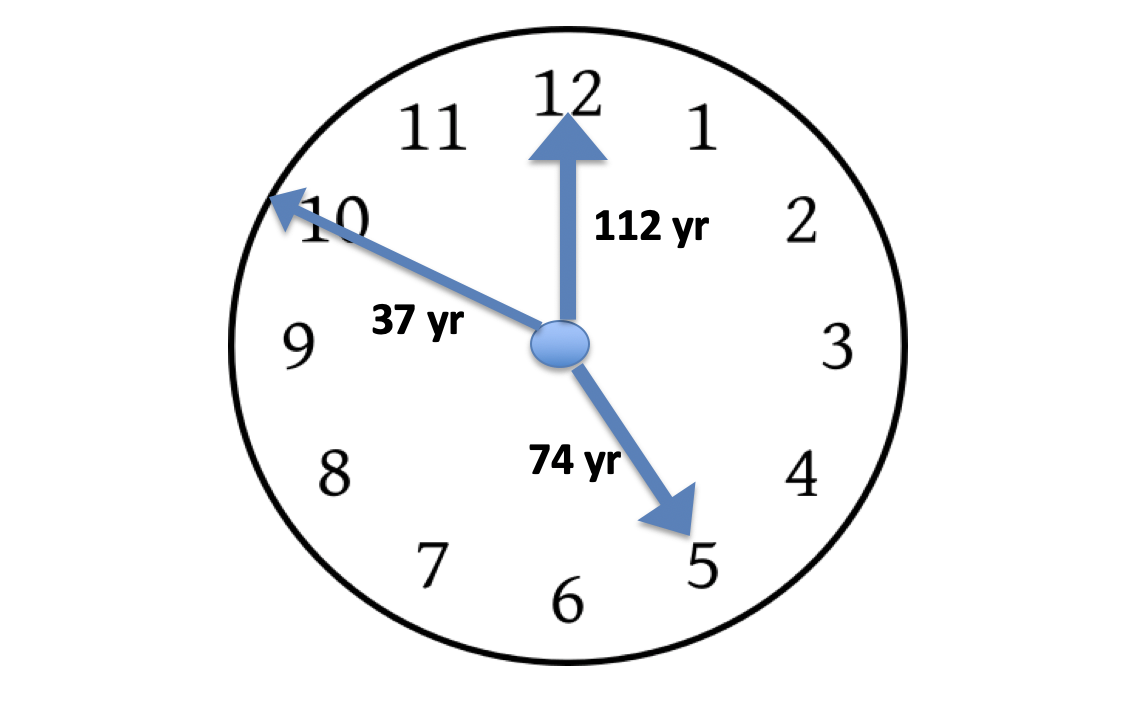
The North Atlantic Oscillation (NAO) index is a weather and climate indicator. The NAO index signature has stationary periods of 37, 74 and 112 years is like a Weather Clock. The Weather Clock indicates a maximum warm period, when all clock-periods have the state 12. A maximum cold period, when all clock-periods has the state 6.
Summary
The identified stationary periods in NAO winter index variability show:
- The NAO index is an indicator of weather and temperature variability in Scandinavia.
- The NAO indicator variability is controlled by a spectrum of 18.6-year lunar nodal periods and a spectrum of 8.85-year lunar perigee periods, which are controlled by the Moon.
- Maximum and minimum trends in the NAO-index, weather and temperature variability, are controlled by period- and phase coincidences.
- The dominant periods have a computed maximum at the year 1993, a negative index state from 2026, and a deep minimum index at the year 2047 [5].
- The distance from a deep minimum at 1966 to a maximum NAO index in 1993, is a rare event in a period of 220 years.
NAO as weather indicator
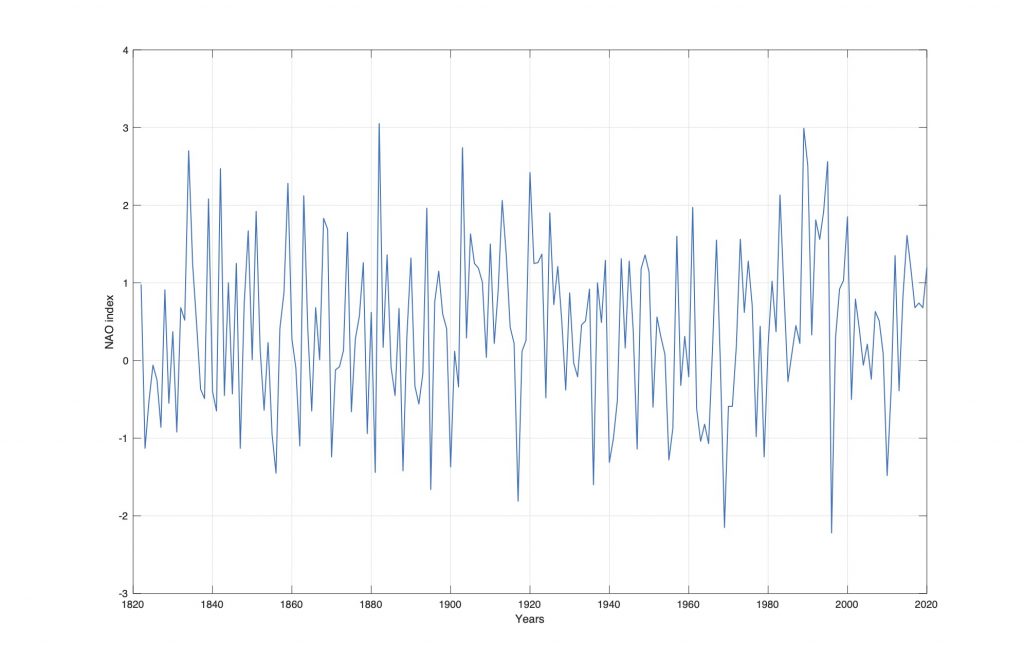
Figure 1. The NAO winter index from 1822 to 2020.
The Weather Clock is computed from the North Atlantic Oscillation (NAO) index. The Figure 1 show the NAO winter index from 1822 to 2017. The NAO winter (December thru March) index of the NAO is based on the difference of normalized sea level pressure (SLP) between Lisbon, Portugal and Stykkisholmur/Reykjavik, Iceland.
The NAO index is a well known weather indicator for Northern Europa. In Scandinavia:
- Positive values of the NAO index are associated with low atmospheric pressure difference between Iceland and Azores. In Scandinavia a positive index causes warm winds from west, mild winters and more rain in summers.
- Negative values of the NAO index are associated with high atmospheric pressure difference between Iceland and Azores. In Scandinavia a negative index causes cold winds from north, cold winters and less rain full summers.
Arctic resonance
The NAO-index variability is not well understood. This investigation confirm that the NAO winter index is controlled by a spectrum of lunar nodal periods. Lunar nodal periods are identified in North Atlantic Temperature variability, in Arctic ice extent, Arctic Ocean water circulation and Earth axis rotation [3]. The relations indicate a possible Arctic coincidence resonance in the Arctic Ocean, like a rotating Wineglass. The “Wineglass” hypothesis is based on the idea of a possible resonance in Arctic Ocean, caused by the 18.6-year Earth Axis nutation oscillation. The stationary Earth Axis oscillation may cause an Arctic ocean water circulation, like a wobbling wineglass [3]. Lunar forced Atlantic inflow to Arctic Ocean influences Arctic ice extent, Arctic air temperature and the NAO index.
Weather trend specter
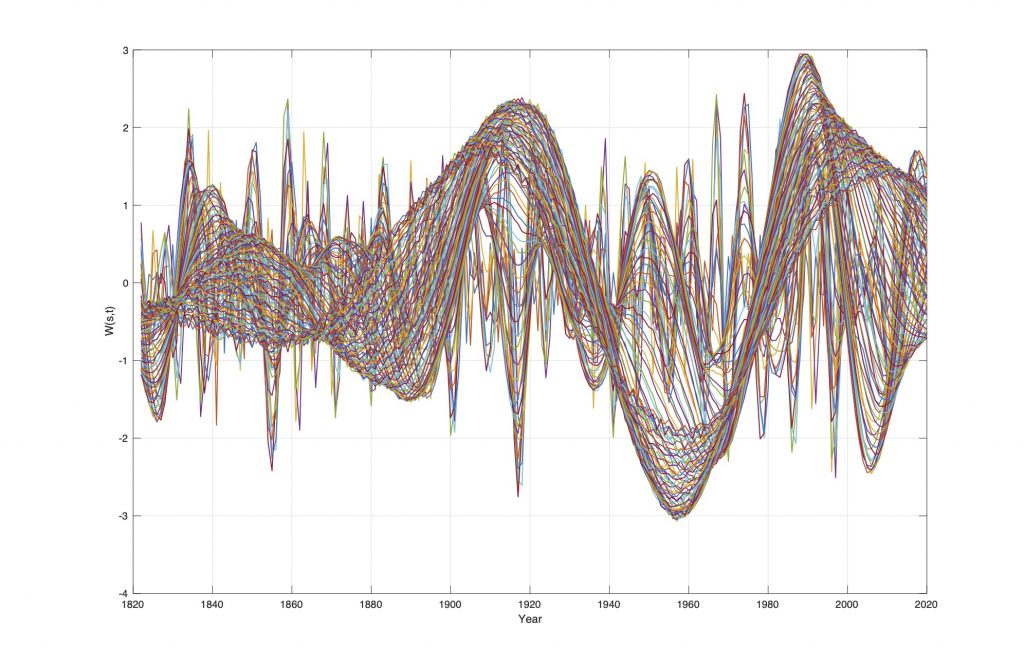
Figure 2. Wavelet spectrum W(nao, s, t) of the NAO winter index data series, for s = 1…0.6N and t=1900 to 2020.
The wavelet specter show trends in weather variability. The computed wavelet spectrum W(nao, s, t) of the NAO-index series is shown on Figure 3. The wavelet spectrum W(nao, s, t) has a time period from 1900 to 2013 and a wavelet scaling range is s = 1…0.6N, and the data series contains N = (2017-1822) = 195 data points. The wavelet spectrum W(nao, s, t) on Figure 4 shows phase shifts at the states:
P(nao, min, yr.) = [(-1.5, 1888), (-2.9, 1957)], at minimum NAO
P(nao, -0, yr.) = [(0,1832), (0, 1899), (0, 1977)], NAO shifts
P(nao, max, yr.) = [(0.49, 1852), (2.19, 1919),(2.9, 1990)], maximum NAO
Weather trend shift periods
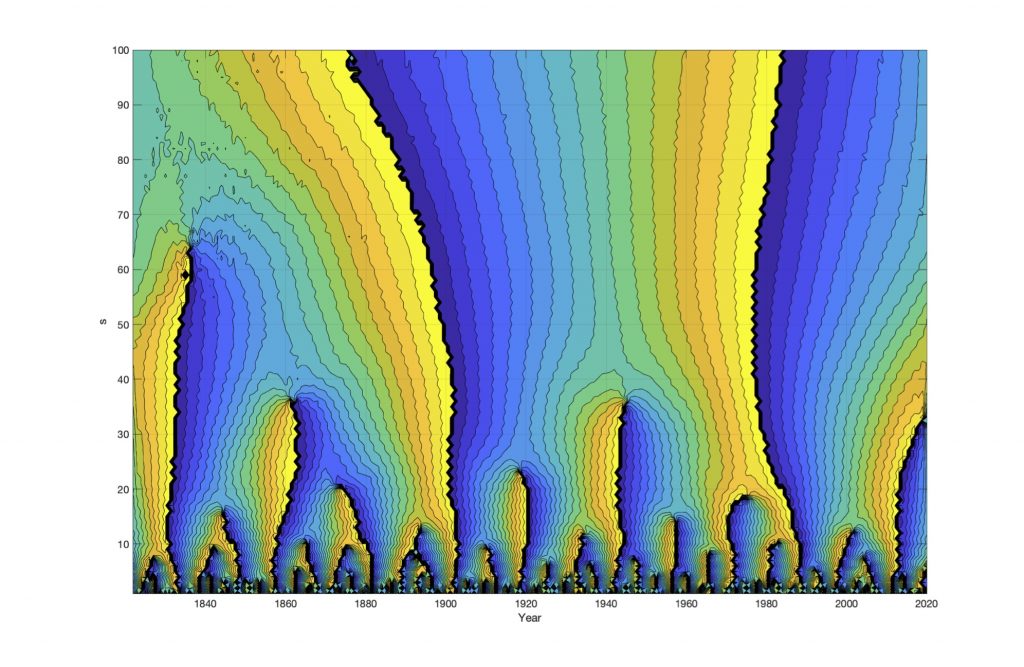
Figure 3. Wavelet phase spectrum WF(nao, s, t) of the NAO wavelet spectrum W(nao, s, t), for s=1…0.6N.
The wavelet phase specter show the periods shifts in NAO index variability. The total wavelet phase spectrum in Figure 4, is like a map, that identifies long and short weather shifts periods. The Figure 4 shows the wavelet phase spectrum from the NAO winter index. The wavelet phase spectrum WF(nao, s, t) is identified by computing a Hilbert transform of the wavelet spectrum. The wavelet phase spectrum WP(nao, s, t) has (-/+) phase shifts, and weather shifts, from the years: WF(nao, -0, long) = [1833, 1902, 1978], WF(nao, -0, short) = [1833, 1862, 1902, 1943, 1978] (yr.).
Stationary periods
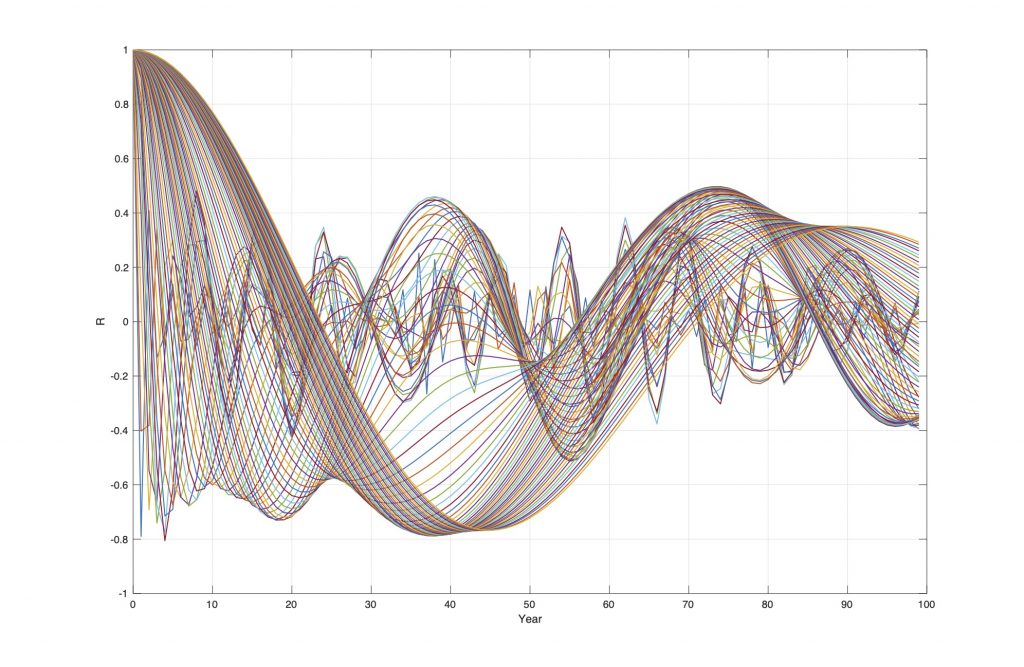
Figure 4. Autocorrelations of the wavelet specter (Figure 2).
Figure 4 shows the autocorrelations WA(R(s), m) of the wavelet spectrum W(s, t) of the NAO index from 1822 to 2020. The computer autocorrelations identifies the correlations R() = [0.3, 0.5, 0.4, 0.5, 0.4] to the stationary periods T() = [18, 38, 54, 74, 112] (yr.), which has a coincidence to the lunar nodal spectrum Tln() = [1, 2, 3, 4, 6]18.6 (yr.). The 18.6-year period is controlled by the 18.6-year lunar nodal tide, which introduces a lunar nodal temperature spectrum Tln() in North Atlantic Water and Arctic Ice extent [3].
The Weather Clock Model
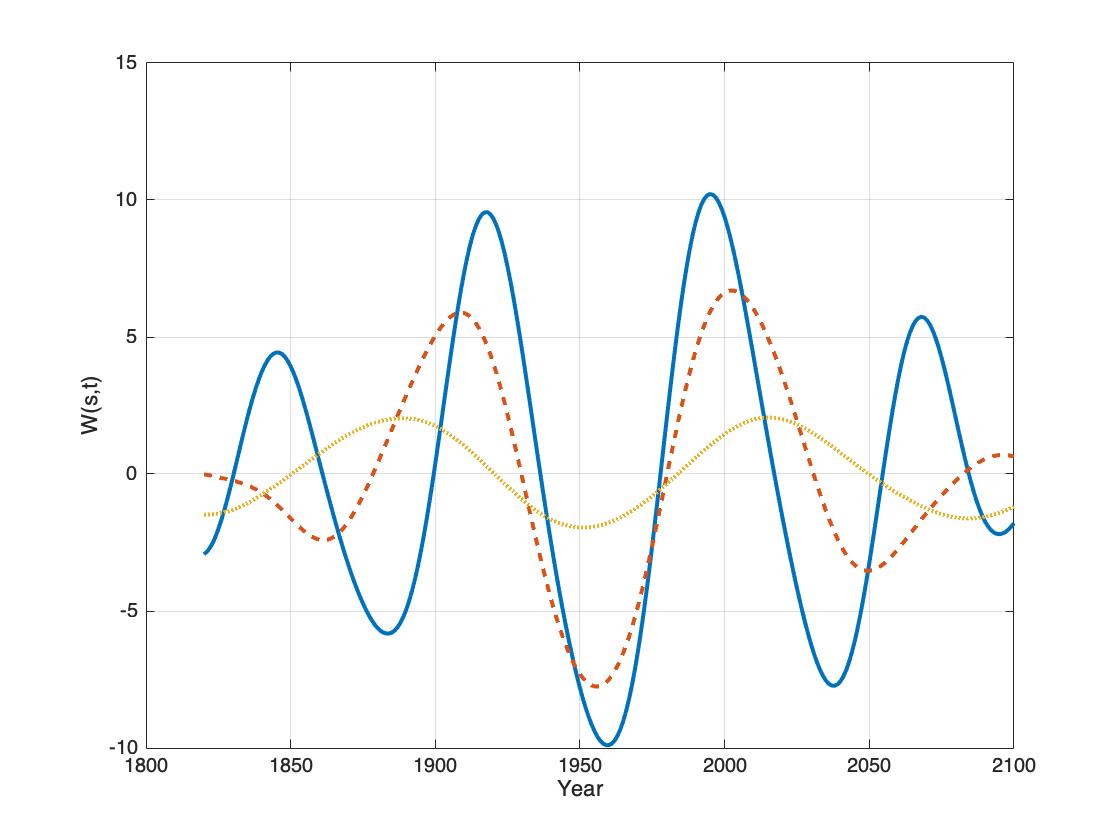
Figure 5: Identified dominant wavelet periods in the computed NAO index P(nao, t) = Ix for t = 1820…2100. Blue, red, yellow are W(nam, s(37), t), W(nao, s(74), t), W(nao, s(112), t).
The Figure 5. shows the identified dominant periods in the NAO index variability, Dominant periods of 37-year(blu), 74-year(red) and 112-year(yellow). The Figure 5 show the period phase coincidences between the stationary periods from 1900 to 2020. This coincidence may explain the large variation in weather and climate in the same period.
The periods [37, 74, 112] (yr.) has an upcoming next maximum positive coincidence the year 2140. The period have a maximum negative coincidence the year 2192, or 230 years after the negative coincidence in 1960. This mean that the climate change from 1960 to 2000 is a rare event,

Figure 6: Wavelet power spectrum WP(nao, s, t) of the deterministic model of the NAO data series, for s=1…0.6N and t=1820 to 2100.
The wavelet power spectrum represents the power impact of deep minimum and maximum computed NAO index periods. The Figure 6 show the wavelet power spectrum from 1822 to 2017. The wavelet power maximum at: WP(nao, s, t) = [(18.3, 1824), (26.9, 1845), (40.0, 1881), (106.7, 1918), (167.3, 1957), (138.4, 1998), (64.7, 2037), (44.0, 2067), (11.23, 2090)]. Power spectrum show maximum coincidence between the stationary lunar periods in NAO index variability. The power spectrum has a maximum coincidence at time distances of [36, 37, 39, 41, 39] (yr.), or a mean distance of 38.4 years or a period of 76.8 years.
Computed upcoming events
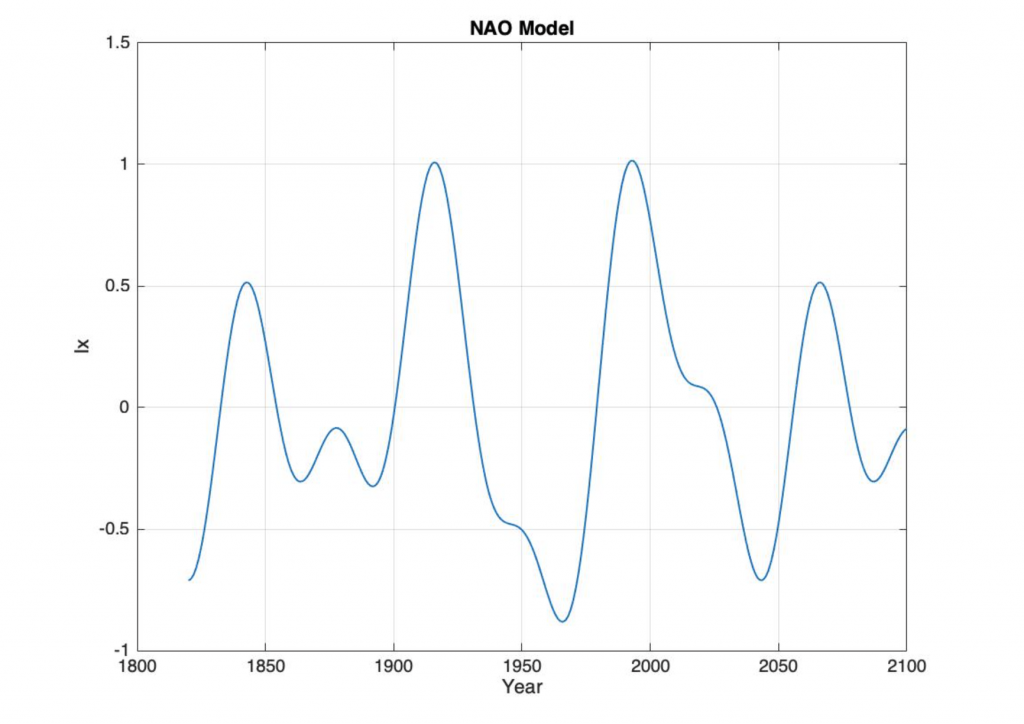
Figure 1. The computed Weather Clock state from 1820 to 2100.
The Figure 1 show the computed sum of 37, 74 and 112 year Weather Clock periods from 1820 to 2100. The result show the computed Weather Clock index state (Ix) at a year T for: (Ix, T) = [(-0, 1833), (0.50, 1843), (+0, 1854), (-0.30, 1863), (-0, 1900), (+0, 1931), (-0.88, 1966), (-0, 1979), (1.0, 1993), (+0, 1926), (-0.71, 1943), (+0, 2056), (0.51, 2067), (+0, 2078)].
The computed NAO index has a maximum at the year T= 1993, an upcoming negative trend from the year 2026, a deep minimum at the year 2043, temporary maximum at 2067, a temporary minimum at 2116, a global maximum at 2140 and a deep minimum at 2182. The distance between global maximum and between global minimum are 2140-1993 = 147 year and 2180-1967=213 years. This mean that the 30-year distance from a deep minimum at 1966 to a maximum index at 1993, is a rare event in a period of 220 years.
Summary
The identified stationary periods in NAO winter index variability show:
- The NAO index is an indicator of weather and temperature variability in Scandinavia.
- The NAO indicator variability is controlled by a spectrum of 18.6-year lunar nodal periods and a spectrum of 8.85-year lunar perigee periods, which are controlled by the Moon.
- Maximum and minimum trends in the NAO-index, weather and temperature variability, are controlled by period- and phase coincidences.
- The dominant periods have a computed maximum at the year 1993, a negative index state from 2026, and a deep minimum index at the year 2047 [5].
- The distance from a deep minimum at 1966 to a maximum NAO index in 1993, is a rare event in a period of 220 years.
References
[1] Wikipedia: https://en.wikipedia.org/wiki/North_Atlantic_oscillation).
[2]. Hurrell: https://climatedataguide.ucar.edu/climate-data/hurrell-north-atlantic-oscillation-nao-index-station-based
[3]. Yndestad, 2006, The influence of the lunar nodal cycle on Arctic climate, ICES Journal, Volume: 63, Issue: 3, Pages: 401-420.
[4] University of East Anglia: https://crudata.uea.ac.uk/cru/data/nao/nao.dat
[5] Harald Yndestad: The NAO index and Lunar Variability. NTNU-Ålesund. 2019.