


Greenland temperature (GISP2) variability is controlled by lunar nodal cycle periods of (1, 4, 8, 16, 24)18.6 years and solar forced periods of (166, 333…4450) years [1]. Cold climate periods in “The Little Ice age” has coincidences to lunar forced periods of 445 years and solar forced periods of (333, 4450/2, 4450) (yr.). (Yndestad H. 2020. https://doi.org/10.3389/fspas.2022.839794).
Greenland temperature from 2000 BC to 2000 AD

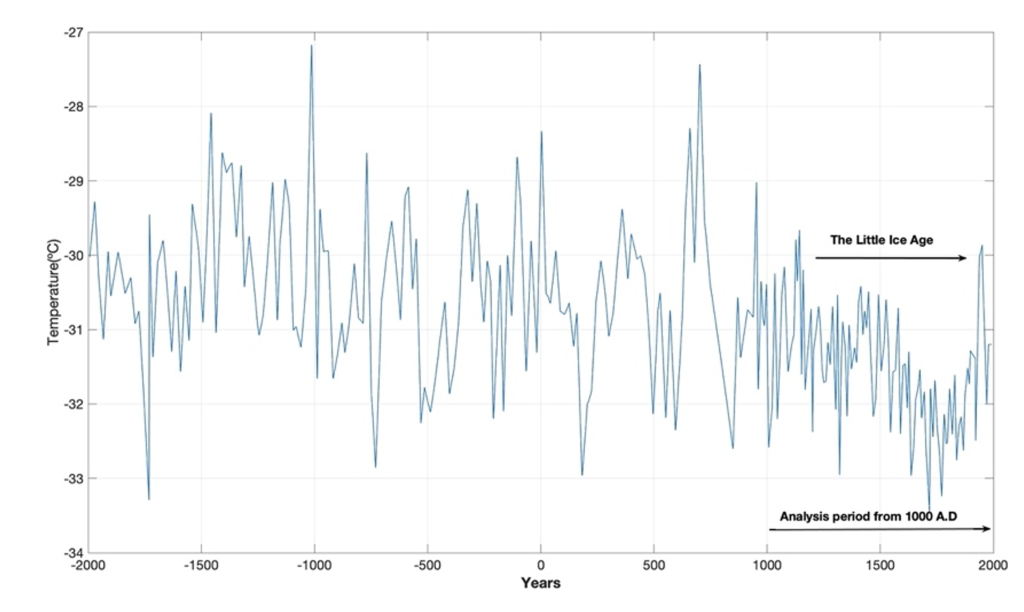
Figure 1. Greenland temperature (GISP2) from 2000 BC to 1993 AD.
Figure 1 show the Greenland temperature from 2000 BC to 1993 AD. The temperature variability looks random from 2000 BC to 1000 AD. From 1000 AD the temperature is reduced to a minimum at 1500 AD., known as “The Little ice age”, the coldest periods in 4000 years. From 1500 to 1993 AD the temperature is recovering to a normal state [1].


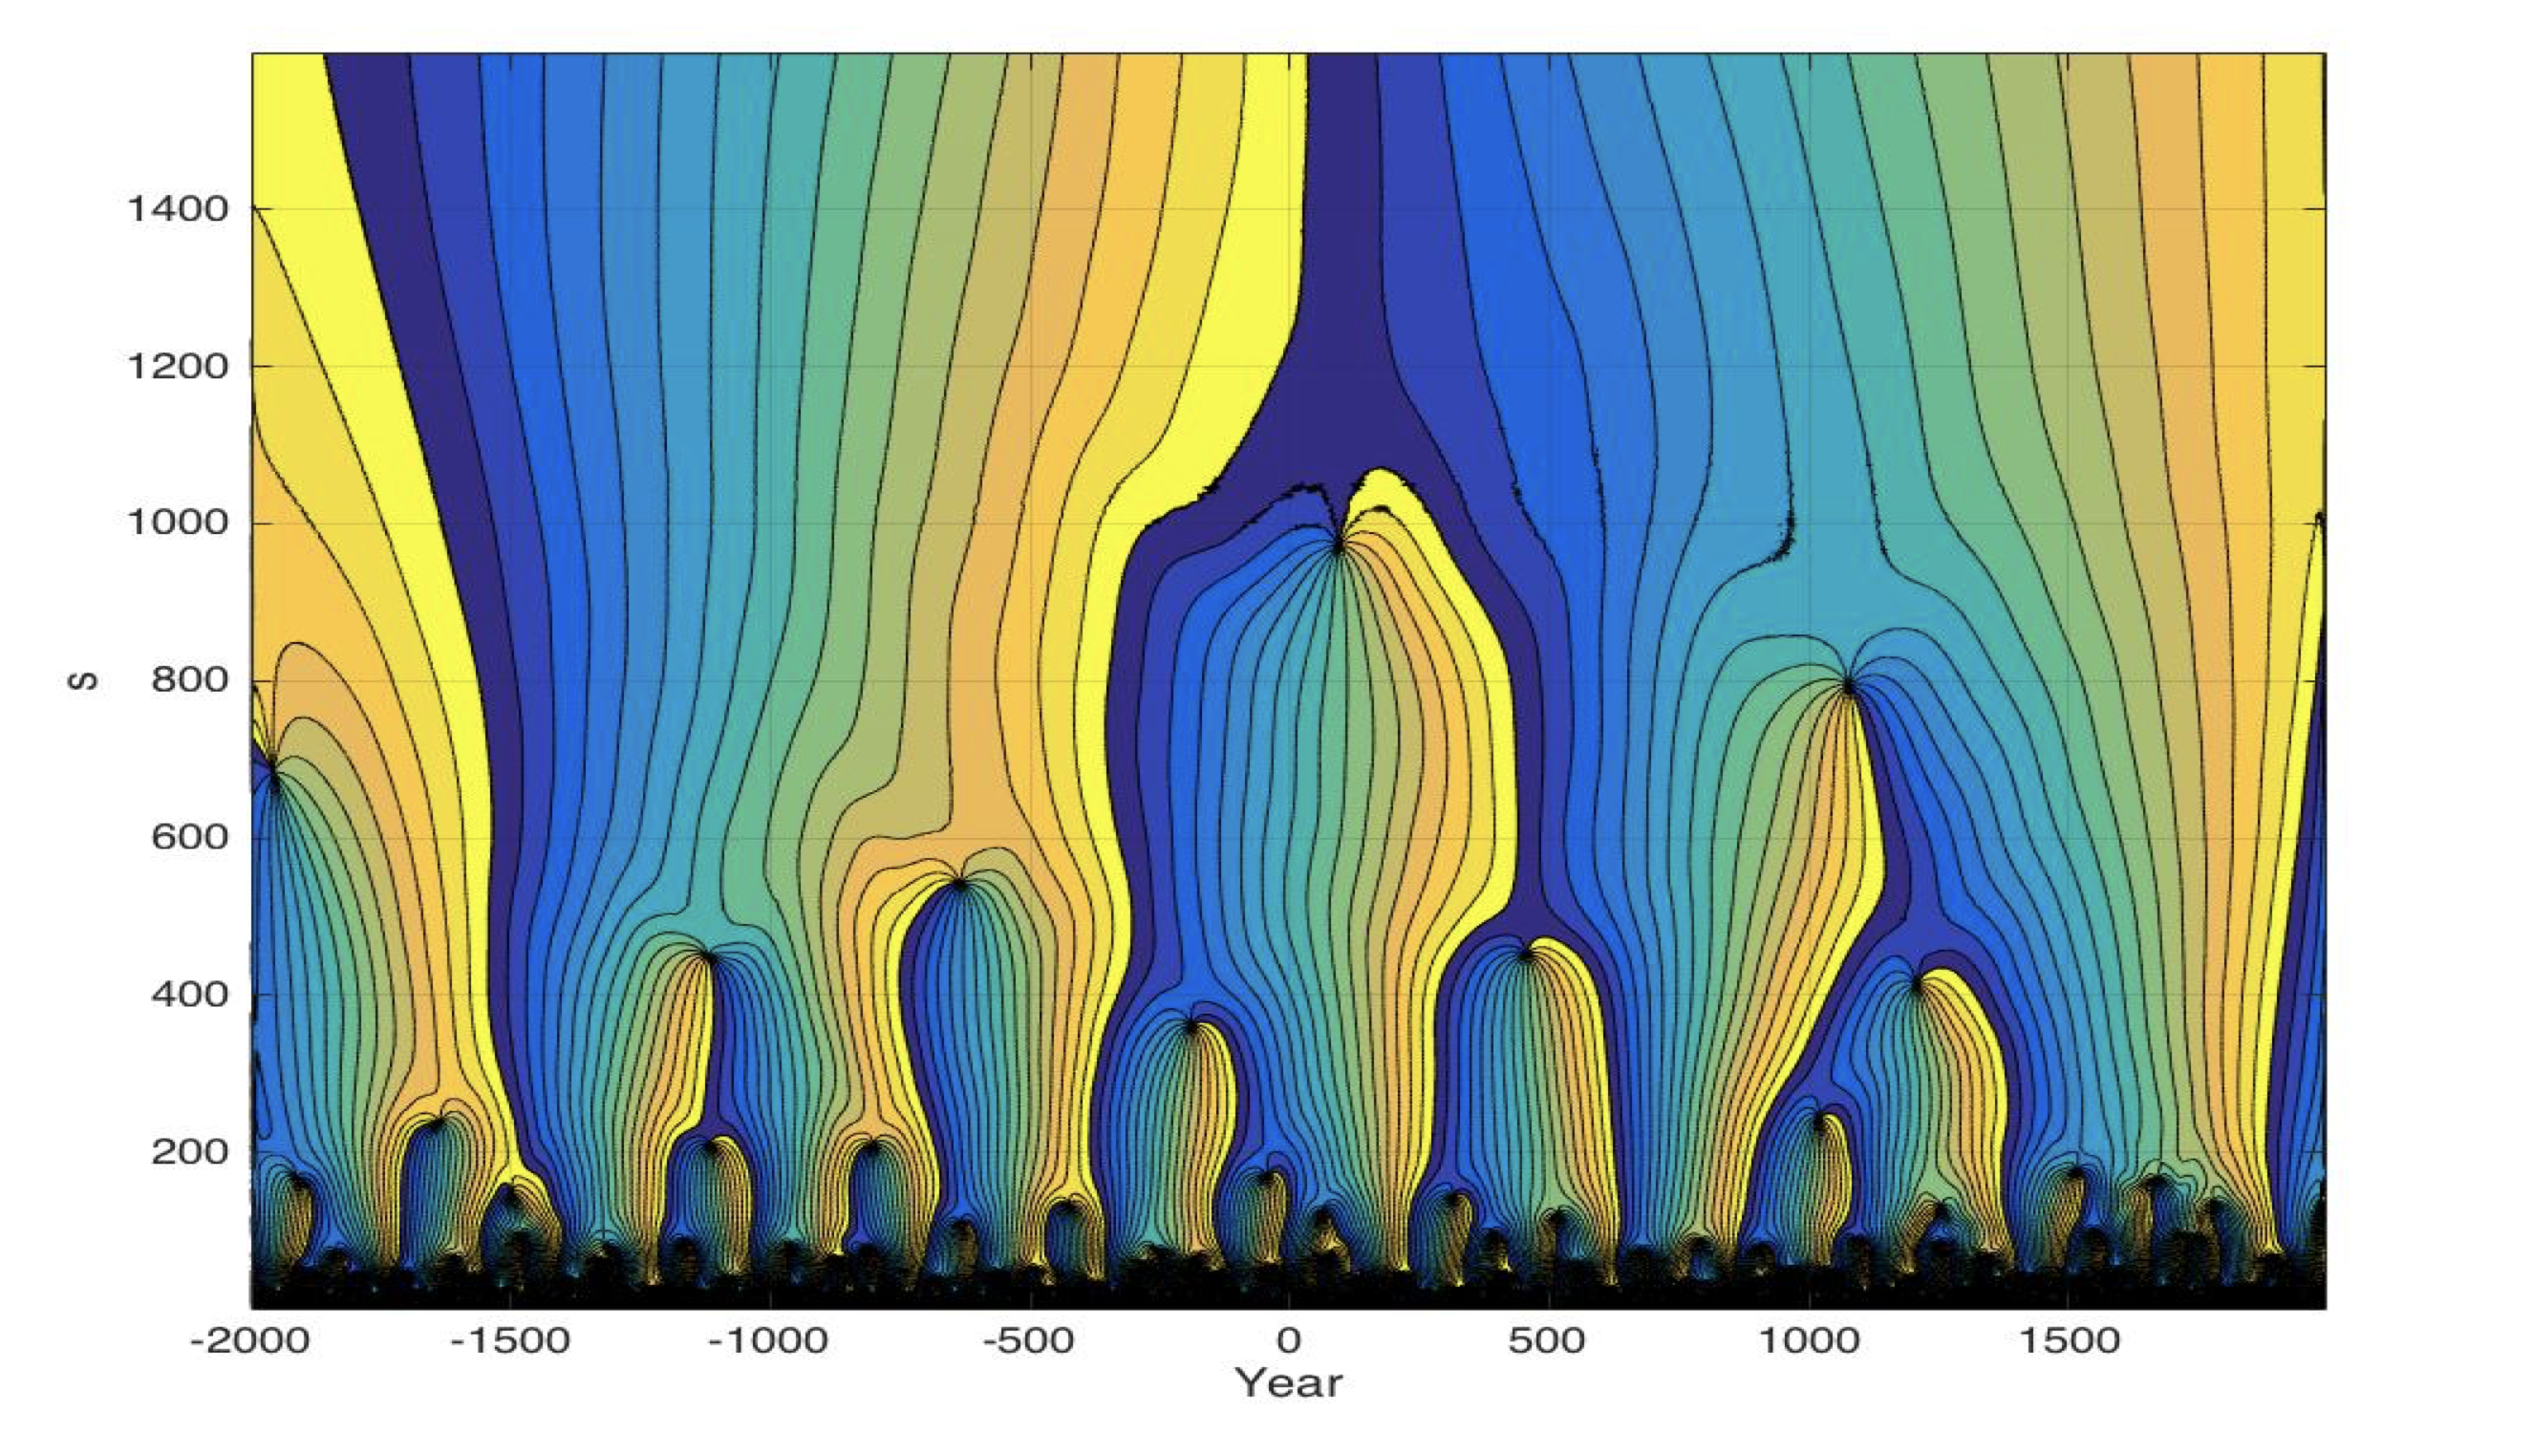
Figure 2. Greenland’s GISP2 temperature wavelet spectrum, WPgrt (s, t), for t = (−2000 . . . 1993) (yr.) and s = (1…2000). The wavelet power spectrum shows dominant warm time periods and cold time periods from 2000 BC.
A wavelet represents moving correlations between a data series and a wavelet impulse function. Wavelet spectrum is represented by a set of scaled wavelets. Figure 2 shows Greenland’s GISP2 temperature wavelet spectrum, Wgrt (s, t), for t = (−2000…1993) (yr.) and s = (1…2000). The wavelet spectrum shows dominant minima and maxima at Wgrt(s=min/max, t) = [(14.0, -1305), (-12.0, -630), (12.0, 595), (-19.0, 1620)].The wavelet spectrum reveals warm maxima at the years (-1356, 595) and cold periods at the years (-630, 1620), in a mean period of 2250 years.

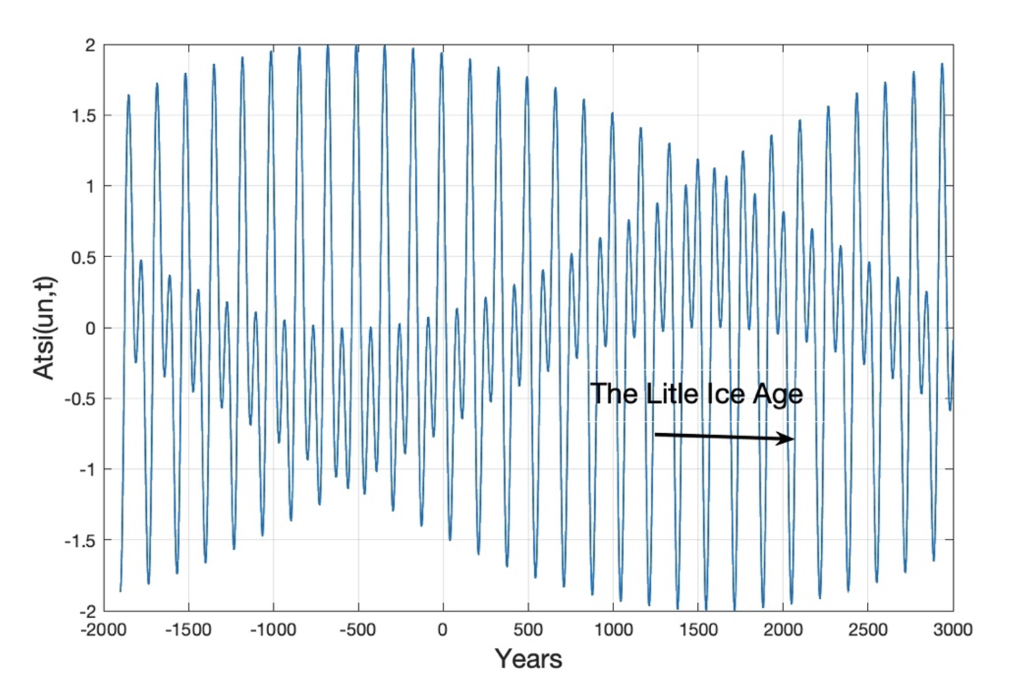
Figure 3. Constructive and destructive interference between Uranus-Neptune forced Total Solar irradiation periods, for the years t = (−2000…3000). “The Little ice age” covers the six constructive Uranus-Neptune minima.
Constructive and destructive interference between Uranus-Neptune forced Total Solar irradiation periods, for the years t = (−2000 . . . 3000) is show on Figure 3. “The Little Ice Age” covers the six deepest Uranus-Neptune minima coincidences in period distances of 166 years [1]. The envelope period has a cycle period of 4450 years, a global maximum at the year 600 and a global minimum at the year 1658. The coincidence difference between the deterministic Uranus-Neptune maximum constructive interference (Figure 3) and estimated Greenland temperature wavelet maxima and minima are 5 and 38 years.

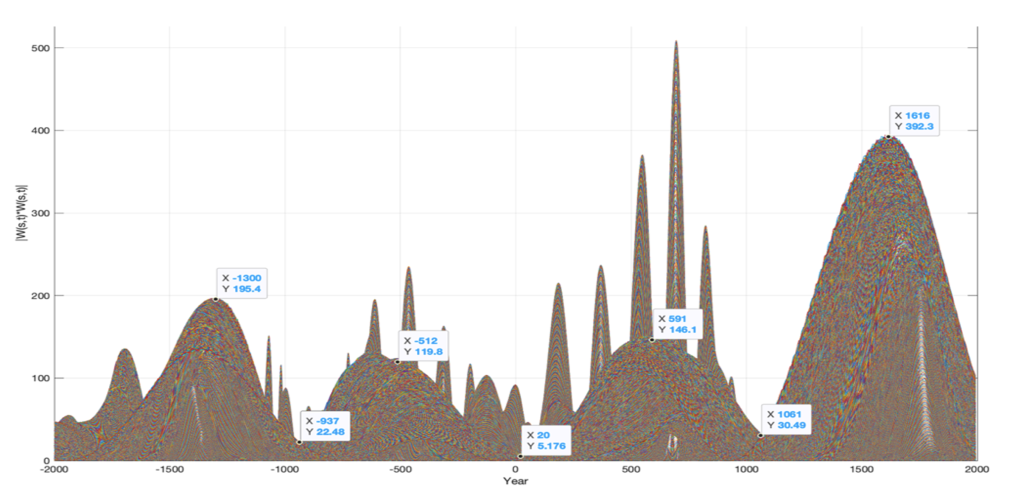
Figure 4. Greenland’s temperature (GISP2) wavelet power spectrum, WPgrt (s, t), for t = (−2000 . . . 1993) (yr.) and s = (1…2000). The wavelet power spectrum shows dominant warm time periods and cold time periods from 2000 B.C.
A wavelet power spectrum, WP(s, t) = W(s, t)*W(s, t), reveals the most dominant periods in the wavelet spectrum. From 2000 B.C., Greenland’s temperature wavelet power spectrum WPgrt(s, t), for t = (-2000 … 1993) (yr.) and s = (1…2000) has maxima of: WPgrt (s = max, t = t0) = ((200, −1300), (120, −513), (147, 585), (392, 1620)), where the years -513 and 1620 represent maxima in cold climate periods. (Figure 4). The time-period spanning from 513 B.C. to 1620 A.D. covers a total period of 2133 years. The stationary temperature cycle has computed phase shifts in the years: Wgrt(t = (t1, t0)) = ((min, −513), (max, 554), (+0, 1086), (min, 1620), (−0, 2153), (max, 2686)).

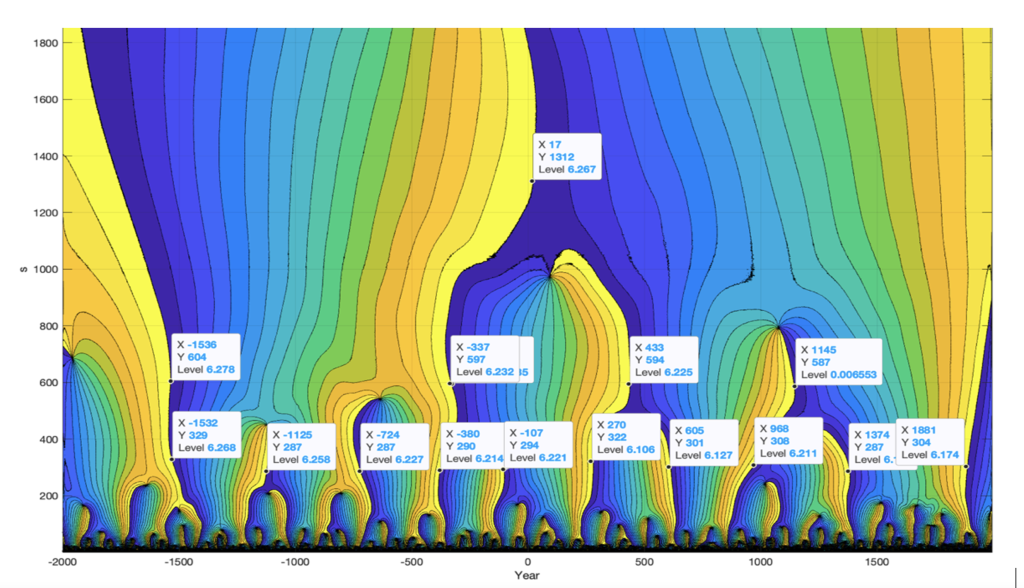
Figure 4 Greenland’s GISP2 temperature wavelet phase spectrum, WFgrt(s, t), for t = (−2000…1993) (yr.) and s = (1…2000). The wavelet phase spectrum shows phase shifts when wavelets (s) have phase shifts at 0 (rad), from 2000 B.C.
A wavelet Phase spectrum, WF(s, t), reveals years when wavelet periods (s) have a phase shift at 0 (rad). From 2000 B.C., the long 2000-year period has a computed phase-shift close to the year 17. From -500 wavelets have phase shifts at the years (-337, 433, 1145), in a mean period of 741 years. Whish are temporary periods in total period of 3*741 = 2223 years.

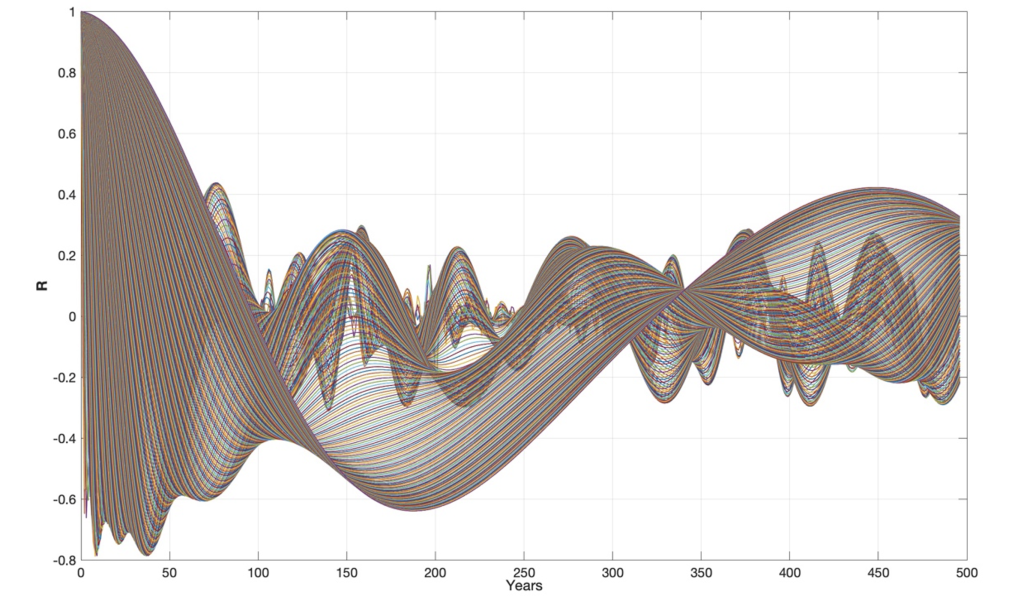
Figure 5. Greenland’s temperature (GISP2) wavelet autocorrelation spectrum, WRgrt(Rgrt(s), m), for s = (1 . . . 500) and m = (1…500) (yr.).
A wavelet autocorrelation spectrum, WA(s, m), reveals stationary cycle periods, harmonic cycle periods and interference periods in the wavelet spectrum W(s, t). Figure 5 depicts the Greenland temperature (GISP2) wavelet autocorrelation spectrum: WRgrt(Rgrt(s, m), of the wavelet spectrum: Wgrt(s, t) for s = (1…500) and m = (1…500) (yr.). The wavelet autocorrelation spectrum, WRgrt(Rgrt(s, m), starting the year 1000, has maxima correlations to the cycle periods: Tgrt = (18, 76, 147, 296, 334, 375, 446) (yr.), where the cycle periods (18, 76, 147, 296, 375, 447) have coincidences to the lunar nodal cycle periods (1, 4, 8, 16, 24)18.6 (yr.) and 334 has a coincidence to the 333-year solar forced period [1].

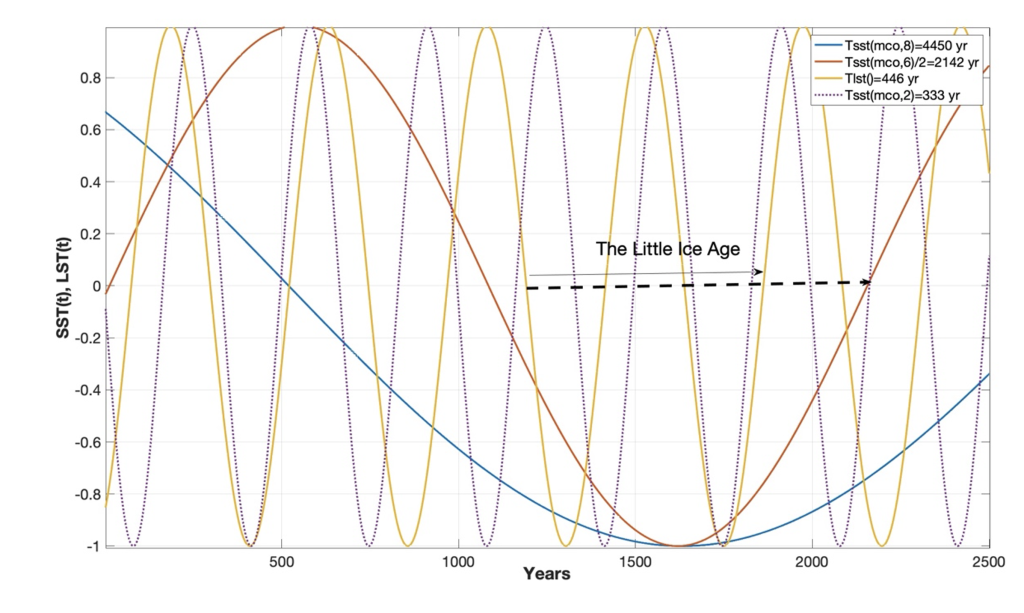
Figure 6. Stationary solar forced sea temperature cycler of (4450, 2142, 333) (yr.) and lunar forced temperature period of 446 years in the years t = (0…2500).
The 332-year solar forced cycle and the 446-year lunar forced cycle have positive constructive interference in the years (165–320), destructive interference in the years (600–1160), and negative constructive interference in years (1330–1420) and (1660–1825). The solar-lunar cycle periods have a computed upcoming negative constructive interference from the year 2085 to 2150 (Figure 6). Temporary negative constructive interference between the identified solar-lunar cycles indicates that “The Little ice age” covers a total time-period of 820 years from 1330 to 2150 AD.
References
[1] Yndestad H. 2020. Jovian Frontiers in Astronomy and Space Science Planets and Lunar Nodal Cycles in the Earth’s Climate Variability. https://doi.org/10.3389/fspas.2022.839794).
[2] Yndestad H: The Earth’s Climate Variability. https://www.climateclock.no/2022/04/28/jsun/
[3] Yndestad H: Lunar forced Global warming. https://www.climateclock.no/2021/03/09/lunar-climate/
[4] Yndestad H: «THE DEEEP FREEZE” https://www.climateclock.no/2021/09/06/the-deeep-freeze-den-kaldeste-vinter/