


Climate data series reveals we are moving into a new serious cold climate period.
- Solar irradiation from the sun has a computed maximum in 2017 and deep minimum in 2050.
- Solar forced climate variation has a computed 500-year maximum in 2025, and a 1000-year deep minimum in 2070AD.
Audio: Little ice ages
Dissertation defense in 2004
I was prepared for a Dr.philos dissertation defense in 2004. The subject was “Climate influence on the Barents Sea. The given trial lecture question was:
“What is the expected response on the ecosystem in the Nordic Seas from the expected climate change?”
The research program Arctic Climate Impact Assessment (ACIA) has recently published a report about climate change. The Report publishes the expected climate change, mainly from increased CO2, caused by human activity. According to this report we may expect:
- The temperature in the Arctic will increase 5-7 degrees the next 100 years.
- Rain in the Arctic will increase by about 8 percent.
- Most of Artic ice will be gone in the summertime.
In my thesis, I reported lunar forced Arctic temperature periods up to 4*18.6=74.44 years. A CO2-driven Arctic temperature by 5-7 degrees the next 100 years, was not likely true from my Arctic data series. I decided to take a short study of a long data series.
Greenland temperature 550-1990 (PC1)

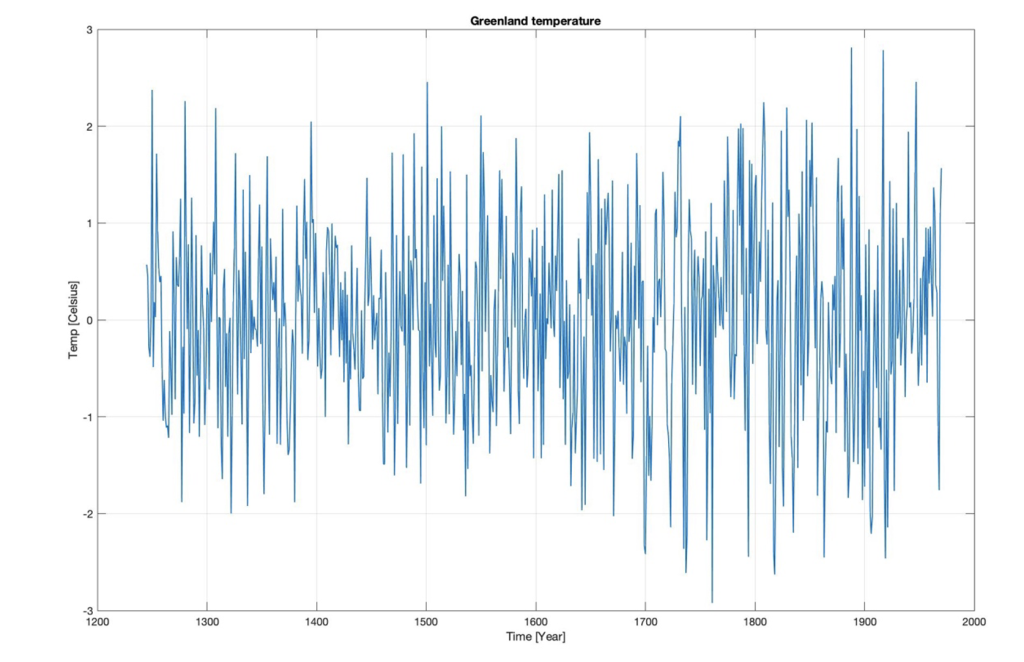
Figure 1. Greenland temperature 550-1990 AD (prof. Bo Vinter, Niels Bohr Institute, Copenhagen, personal communication).
Figure 1 show the Greenland temperature (PC1) from 550-1990. The temperature variations look random and has large variations. A wavelet spectrum transforms was needed to identify possible stationary periods.
Greenland temperature Wavelet spectrum 550-1990

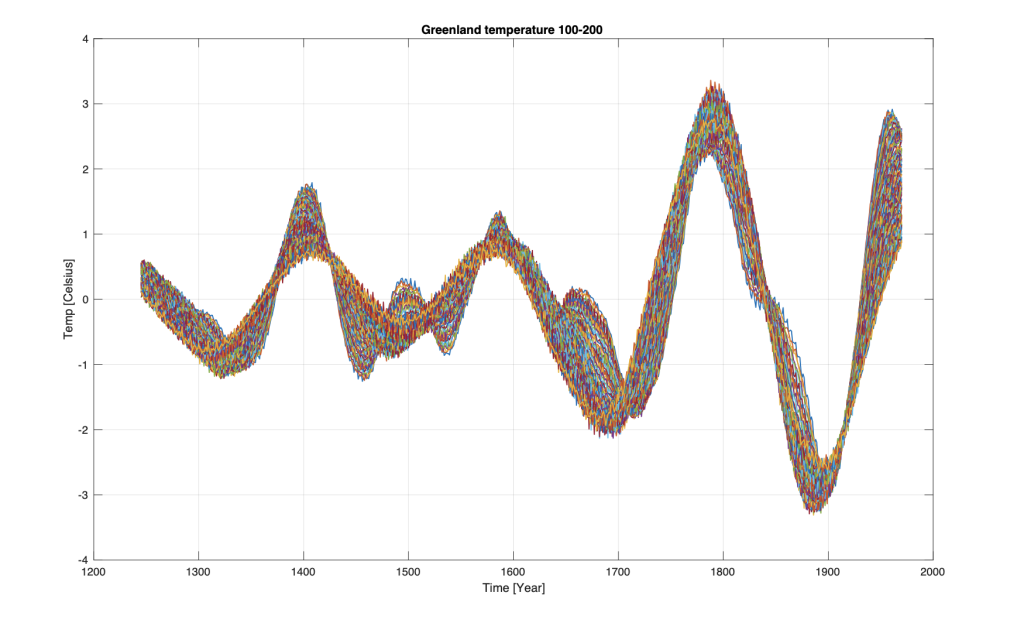
Figure 2. Greenland temperature wavelet spectrum for periods from 100 to 200 years from the years t = 1200-1990
The computed Greenland temperature wavelet revealed stationary climate periods from 550-1990AD. Figure 2 shows the computed wavelet spectrum for periods 100-200 years. The wavelet spectrum of revealed .
- A stationary temperature cycle from 550AD to 1990AD .
- The temperature cycle has an estimated minimum in 1886
- The stationary temperature cycle has a computed next minimum in 2072
A stationary Acetic temperature variation from 550 to 1990 AC is expected to continue in upcoming events. The Greenland temperature data series reveals we may expect an upcoming cold climate period.
Next research questions (2004):
- Are we moving into a new serios cold climate period?
- A deep cold climate minimum in 2072?
A possible source is variations in solar activity from the sun surface,
Solar Activity 1620-2014

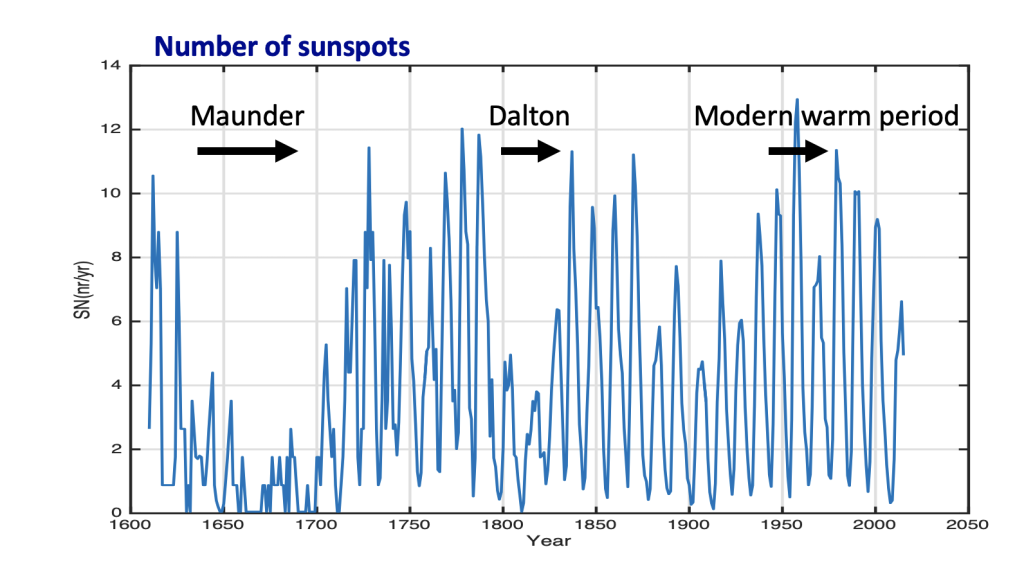
Figure 3 Number of sunspots 1620-2014
The number of black sunspots on the sun´s surface is an indicator of the sun´s activity. Many sunspots are related high sola activity, and more solar irradiations from the sun’s surface.
- The Maunder period is associated with a minimum number of sunspots, deep solar minimum, and a deep cold climate period.
- The Dalton period is associated with a reduced number of sunspots, reduced activity, reduced solar irradiation, and a cold climate period.
- The Modern warm period is associated with a maximum number of sunspots, high solar activity, and a warm climate period.
A next Maunder deep minimum?
There have been speculations about a possible upcoming next Maunder deep minimum and a new cold climate period.
A wavelet analyses of sunspots from 1620 estimated (Yndestad and Solheim 2017)
- An upcoming Maunder-Dalton type solar irradiation minimum in 2036
- The Modern warm period has been turned, into a colder period.
Total Solar Irradiation 1700-2014

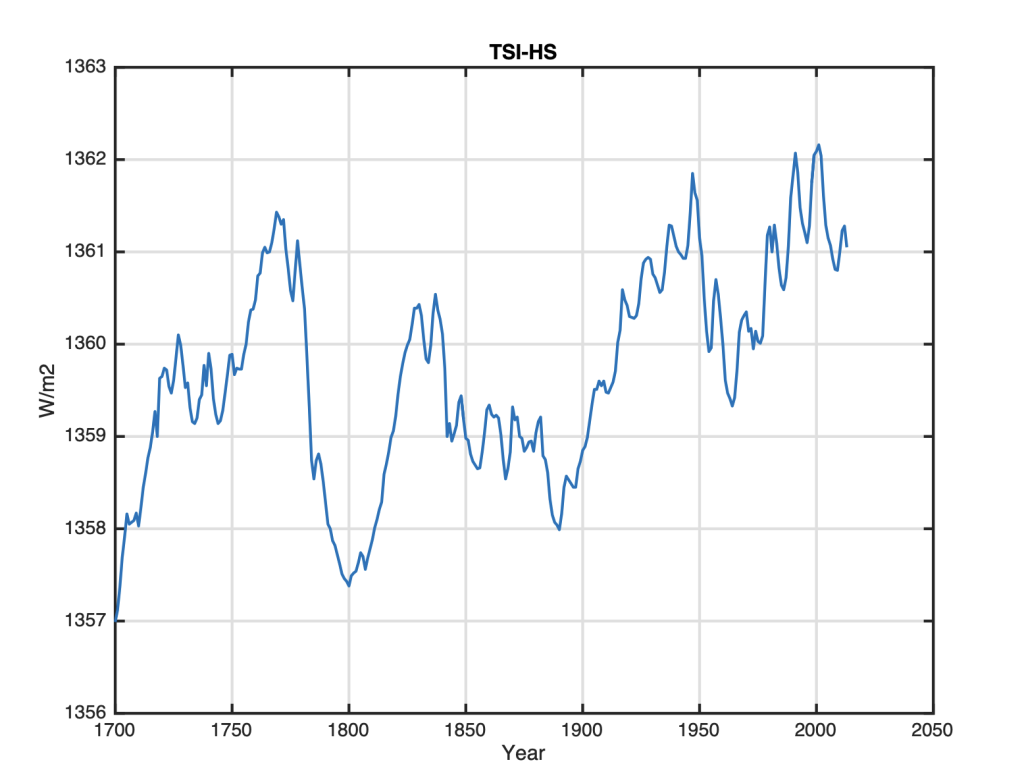
Figure 4. Total Solar irradiation (TSI) 1700-2013 (Scafetta and Willson 2014)
Figure 4 show the Total Solar irradiation from the sun from 1700-2013 (Scafetta and Willson 2014). The data series is estimated from satellite data and other sources. The TSI minima (Figure 4) have coincidences to the Maunder period, Dalton period, and the Modern warm period.
The next research questions.
The minima and maxima open some questions:
- What is the source of TSI minima and maxima?
- Is TSI variations deterministic or random?
- Is there a first cause of TSI variation?
Total Solar Irradiation (TSI) signature

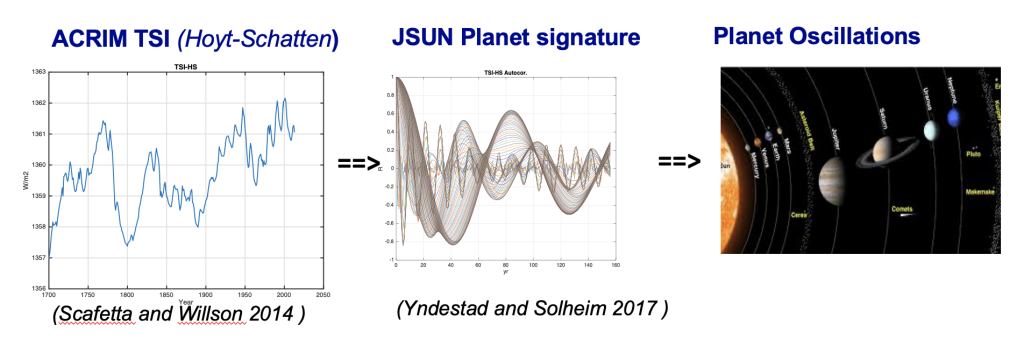
Figure 5. TSI signature analysis, TSI, JSUN planet signature.
A wavelet analysis of TSI 1700-2013 estimated the TSI signature (Yndestad and Solheim 2017). The TSI signature has confirmed:
- TSI has the Jupiter, Saturn, Uranus, Neptune (JSUN) planet signature.
- TSI has deterministic periods, controlled by the large JSUN planets
- The TSI signature has a computed upcoming deep solar irradiation minimum in 2050.
Implications of a JSUN signature in TSI
- TSI variations are controlled coincidences between JSUN period minima and maxima (Interference).
- The JSUN planets is the first cause of climate variation.
- A TSI maximum, is followed by a TSI deep minimum.
Total Sola Irradiation model

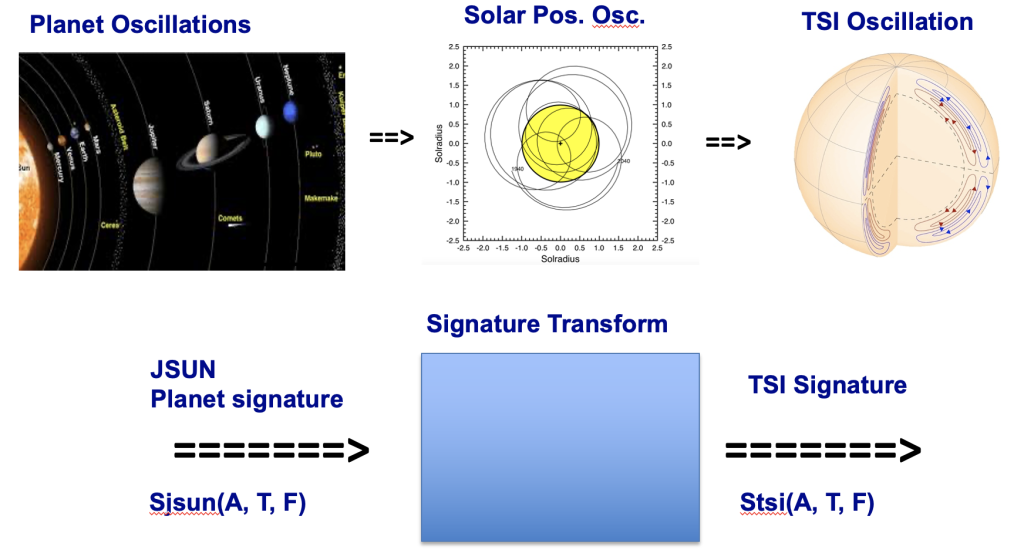
Figure 6. Coincidences between planet oscillations, solar position oscillations, and TSI oscillations (Yndestad 2022).
There is a direct relation between the planet oscillation signature, solar position oscillations signature and the TSI oscillation signature. TSI has a deep minimum, when JSUN planets have a perihelion coincidence. There is a chain of events: JSUN oscillation, solar position oscillation, solar dynamo oscillation, TSI oscillation. This chain of relation may be represented a signature transform model. SUN (Saturn, Uranus, Neptune) forced TSI periods have minima and maxima in periods of [170, 334, 999, 2450, 4450] years (Yndestad 2022). The 170-year period was identified in the Greenland data series 550-1990.
Uranus-Neptune (UN) forced TSI-index

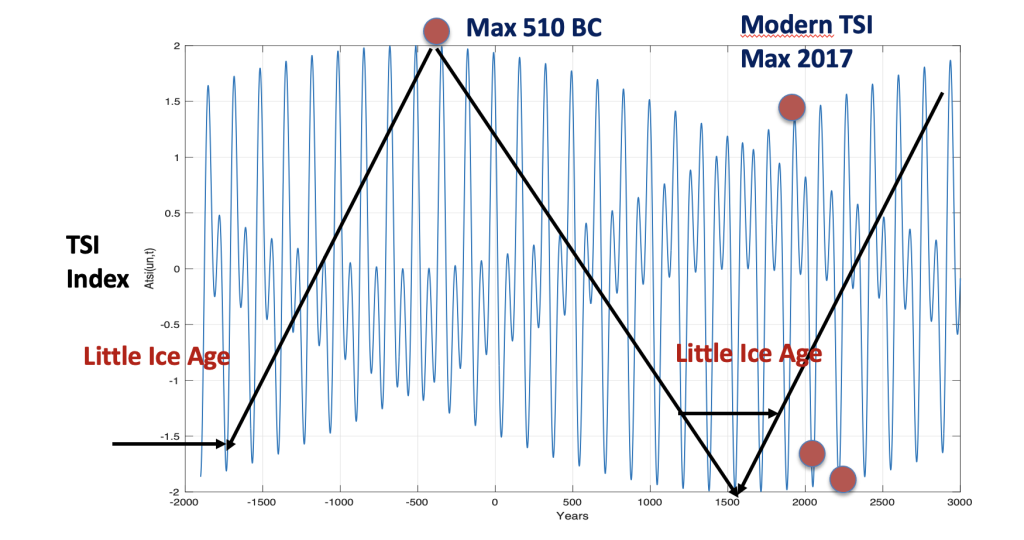
Figure 7. Uranus and Neptune (UN) forced TSI (Yndestad 2022).
Figure 7 shows the implication UN forced TSI. The Figure 7 reveals:
- Uranus and Saturn (UN) have coincidences in a cycle of 4450 years
- UN forced TSI-index has a maximum at 510BC.
- There are two little ice age periods in a 4450-year envelope cycle.
- TSI has a modern maximum at the year 2017AD.
- TSI has two upcoming deep minima after 1850 (2050 and 2211AD).
TSI index and Global land temperature

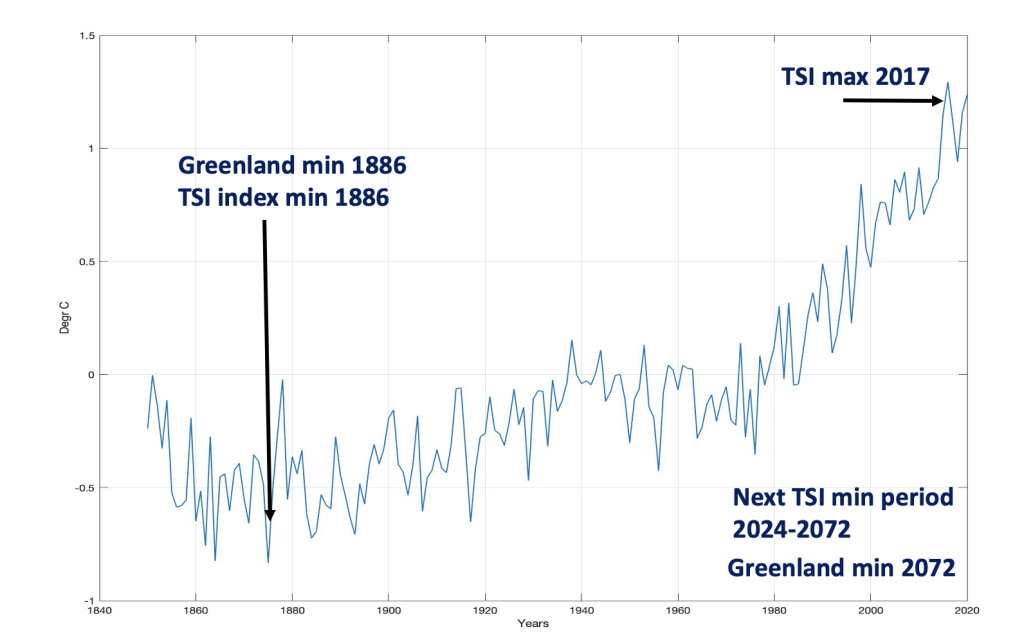
Figure 7: Global land surface temperature coincidence to the TSI index (Yndestad 2022).
The deterministic TSI index has a computed minimum at the year 1886 and a computed TSI maximum at the year 2017.
- The TSI has a coincidence to the estimated Greenland temperature minimum in 1886 (Figure 2) and Global temperature minimum in 1886 (Figure 7).
- The TSI index maximum in 2017 has a coincidence to global land temperature maximum in 2017 (Figure 7).
- The year TSI maximum in 2017AD was the turning point that started an upcoming next cold climate period.
TSI index coincidence to known solar minima

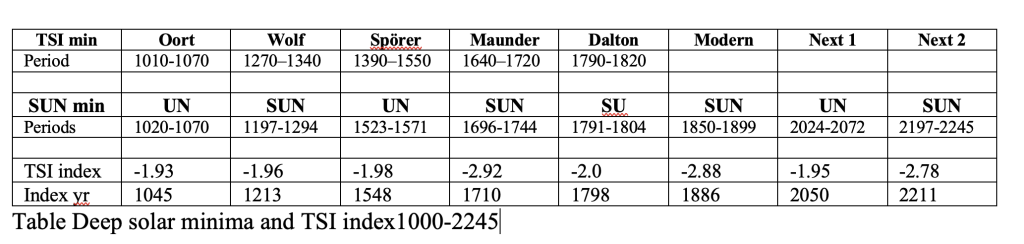
Table 1 Coincidences between known deep solar minima and UN an SUN forced TSI periods (Yndestad 2022).
Table 1 Shows known solar minima from 1000AD (Usoskin 2005). SUN-min is coincidences between SUN (Saturn, Uranus, Neptune) forced TSI periods. UN forced TSI-index = (-2.0…2.0) variations. SUN forced TSI index = (-3.0…3.0) variations. Deep solar minimum for SUN forced TSI index < -2.9 and UN forced TSI-index < -1.9. The Table reveals that:
- There are 8 solar minima from 1000AD-2245AD.
- The deep minima have coincidences to SUN forced TSI period minima.
- There are two more upcoming solar minima. UN-type (2024-2072), SUN-type (2197-2245)
- Next TSI minimum has a computed (UN) deep minimum in 2050AD.
- Next UN forced TSI index = 1.95, close a perfect UN forced minimum TSI index = 2.00
TSI index and Global se temperature

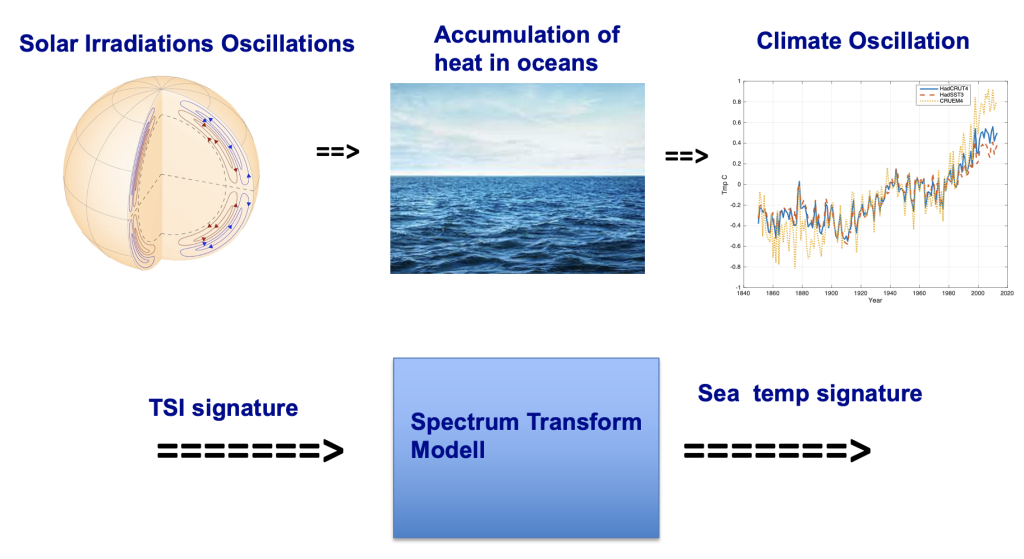
Figure 8. A chain of events from TSI oscillation to global sea temperature oscillations
There is a chain of events from solar irradiation oscillations, accumulation of heat in oceans and global sea temperature oscillations. This chain of events may be computed by a signature transform model.
Global se temperature (SST-index)

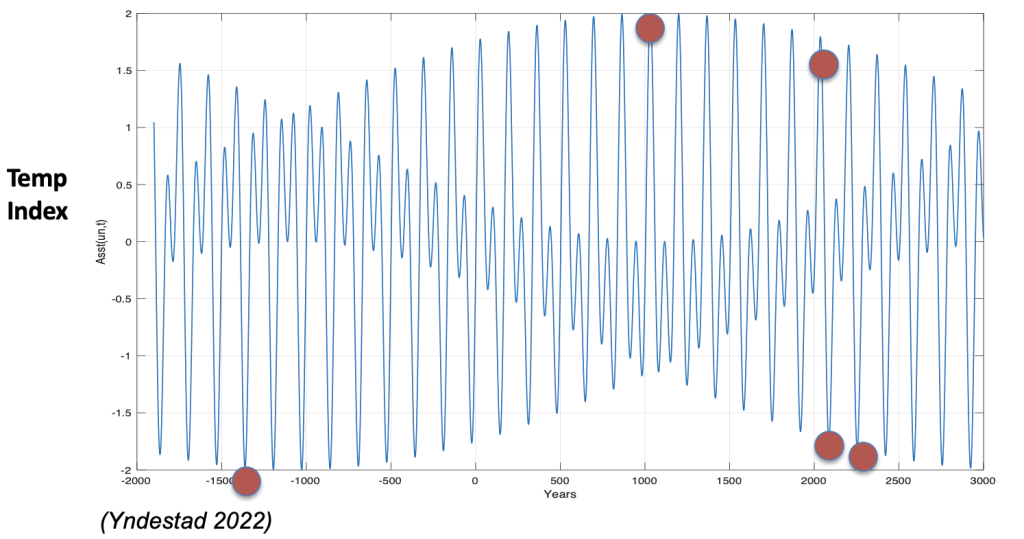
Figure 9. Transformed TSI-index into an SST-index. Global 4450-year SST-index minimum in 1370BC and a 4450-year SST-index maximum in 512AD. A modern maximum in 2025AD and upcoming deep SST-index minimum in 2071AD and 2246AD.
Figure 9 shows a transformed TSI-index into a global sea temperature, SST-index. The transform reveals the implications of new phase relations between SUN forced sea temperature SST-index. The SST-index computes:
- A 4450-year deep SST temperature minimum at 1370BC and 1206BC (End of bronze age)
- A 4450-year SST temperature maximum at 1030AC
- A modern SST temperature maximum at the year 2025
- Upcoming 4450-year deep minima (2071, 2240)
The computed deep minimum in 2071, has a coincidence to the estimated Greenland deep minimum temperature in 2072.
SST-index after solar forced little ice ages

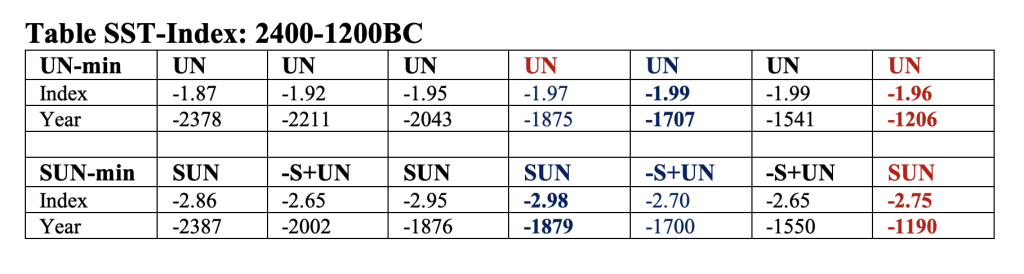
Table 2: SUN (Saturn, Uranus, Neptune) forced SST index and SUN forced sea temperature SST-index from 2400BC-1200BC. The Saturn period (S) has reversed face for -S+UN.
Table 2 shows SUN forced period influenced on the SST-index in the first little ice age period 2400BC-1200BC. The SST-index has a 4450-year minimum at the year 1879BC. The SUN minimum at the year 1190BC has the SST-index = -2.75. This SST minimum has a coincidence to the end of the bronze age and collapse of some civilizations.

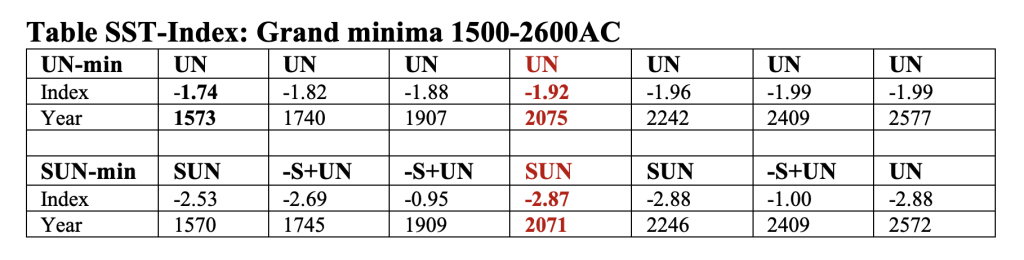
Table 3 shows SUN forced period influenced on the SST-index in the period 1580-2580. The SST-index computes climate minima in 1570, 1745, 1909, 2071, 2246, 2409, 2572…
- The 1745 minimum has a coincidence the little age minimum.
- The 1909 minimum is controlled by the Saturn period and reduces the SST-index.
- The upcoming SUN minimum at 2071 has the SST-index = – 2.87. This SST-index is deeper than the SST-index in 1745, the deepest SST-index since 1879BC.
The research question from dissertation in 2004:
- Are we moving into a new serios cold climate period?
- A deep cold climate minimum in 2072?
Research results in 2022 (Yndestad 2022)
- Wavelet spectrum from real data reveals we are moving into a serious new cold climate period.
- There are 8 deep solar minimum periods from 1000AD to 2250AD.
- Solar irradiation has a computed maximum in 2017 and deep minimum in 2050.
- Solar forced climate variation has a computed 500-year maximum in 2025, and a 1000-year deep minimum in 2071AD.
Research data series
The research is confirmed in several data series:
- TSI: TSI-ACRIM (1000-2014), TSI-ACRIM (1700-2014), Sunspots (1620-2014), Sun position (1200-2100) (Yndestad and Solheim 2017).
- Climate: Global land, sea, and mean temperature (1850-2021), North Atlantic Water (1900-2015), Greenland temperature (PC1) (550-1990), Greenland temperature (GISP2) 2000BC-1990AD
- Climate mode: A 4450-year deterministic TSI signature model and a 4450-year SST signature model.
References
- Yndestad, H., and Solheim, J. (2017). The influence of solar system oscillation on the variability of the total solar irradiance. New Astronomy, 51, 135–152. doi.org/10.1016/j.newast.2016.08.020.
https://ntnuopen.ntnu.no/ntnu-xmlui/handle/11250/2473902 - Yndestad H. (2022). Jovian Planets and Lunar Nodal Cycles in the Earth’s Climate Variability Frontiers in Astronomy and Space Sciences. May 10. 2022. https://doi.org/10.3389/fspas.2022.839794