
The Solar Activity has deterministic periods controlled by the large planets. The periods have a coincidence to the warn period from 1925 to 2015 and predicts an upcoming Grand Solar minimum and a cold climate period close to 2060-2100.
Summary
- A stationary period spectrum of n*11 years for n = 1, 2, 3,, in coincidence to the stationary 11.07-year Schwabe cycle, controlled by the planets Jupiter, Earth and Venus.
- The 11.07-year specter has a 177.7-year coincidence resonance to the periods [88.56, 177.7] (yr). The periods are known as Gleissberg and Solar Barycenter resonance periods, controlled by the planets Saturn, Uranus and Neptune.
- The identified dominant 178-year solar activity period has coincidences to known Grand solar minima from 1000 A.D.
- The 89-year and the 178-year long periods have a 50-year positive phase-coincidence to maximum sola activity from 1933 to 1984 in a modern solar maximum activity period from 1925 to 2015.
- The solar periods have minima coincidences from the years Fsa(2073) to Fsa(2103), computed minima at the years [2060, 2096] and a computed Grand deep minimum close to the year 2077 A.D
1 The Solar Activity
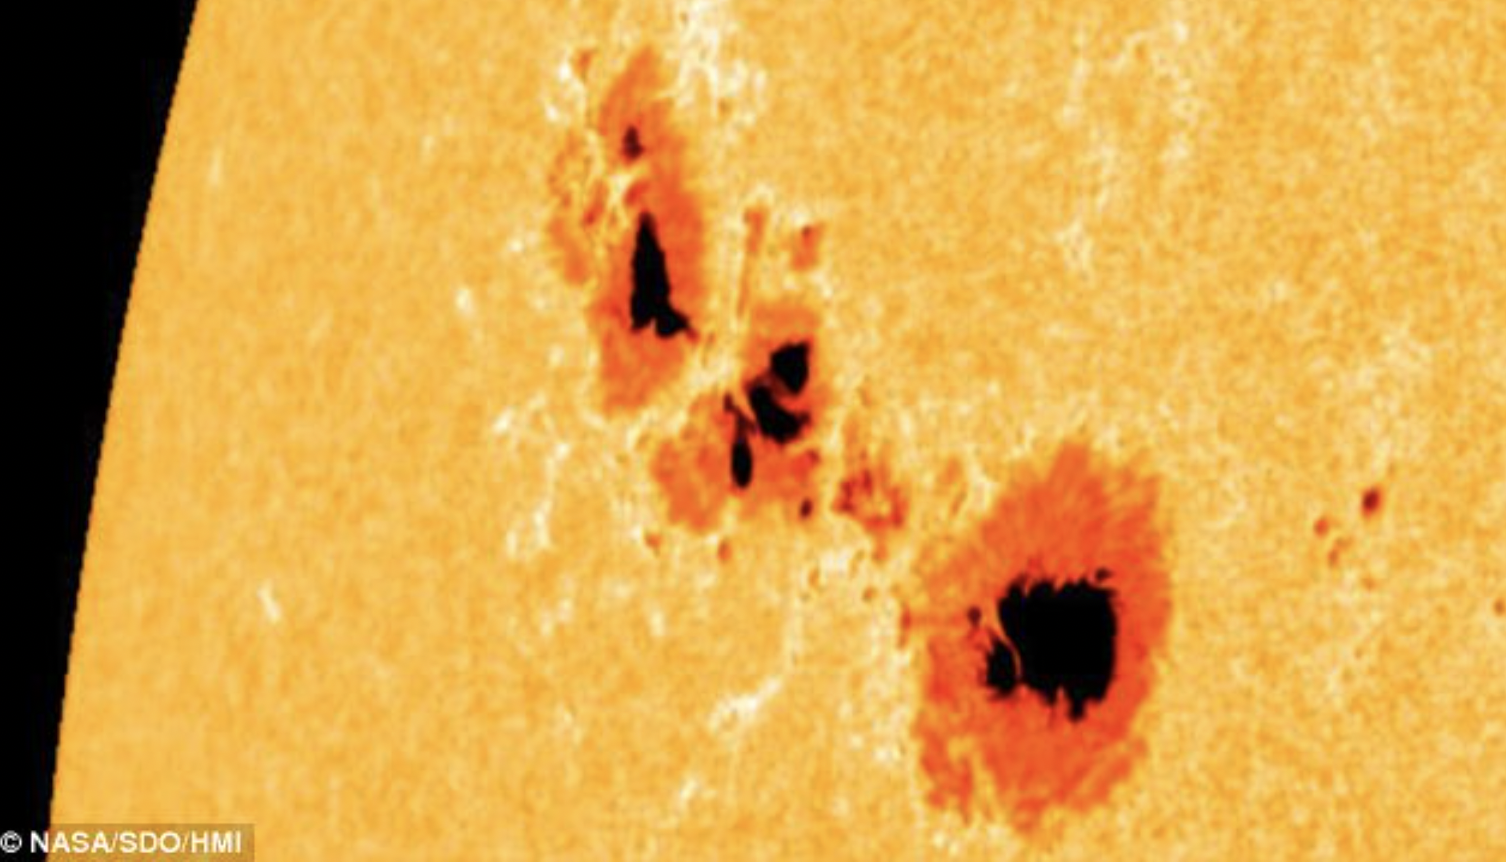
Figure 1. Sunspots on the Sun. https://en.wikipedia.org/wiki/Sunspot
The assumption that solar activity where immutable, as postulated by Aristotle (384-322 B.C.), was believed for millennia in numerous societies. Galileo Galilei resumed his observations of sunspots in April 1612. In his letters to Wesler, published in 1613, he identified sunspots correctly as markings on the sun, confirming that the sun rotated monthly, as the position of the spots moved. Although some transient changes of the Sun were observed with the naked eye, the introduction of the telescope in approximately 1600 demonstrated that the Sun possessed spots that varied in number and location. The sun has an activity and sunspots numbers became an indicator of solar activities.
From 1610, systematic observations were reported. A pattern of sunspot variations was established when Heinrich Schwabe began regular observations of sunspots in 1826. He reported a possible period of approximately ten years presented the opinion that the planets Venus, Earth, Jupiter and Saturn modulate the solar variability. Rudolf Wolf started systematic observations of sunspot numbers in 1849. He also collected previous observations to construct daily sunspot numbers from 1750 and a yearly series from 1700. The cycle that started in 1755 became 60 sunspot cycle 1.
The solar activity cycle (Hathaway, 2015) consists of dark sunspots and bright regions (faculae) in addition to active regions that exhibit sudden energy releases (flares). The average cycle length is 11.07 years. During a cycle, the number of spots increases to a maximum and then decreases. The average lifetime of a sunspot is slightly longer than the solar rotation period. They are bipolar, with the same magnetic polarity that leads with respect to the direction of the solar rotation. When the next cycle starts, spots appear with opposite polarity at high latitudes in both hemispheres, and as the cycle progress, they appear closer to the equator (Yndestad and Solheim, 2019).
1.1 Solar activity cycles
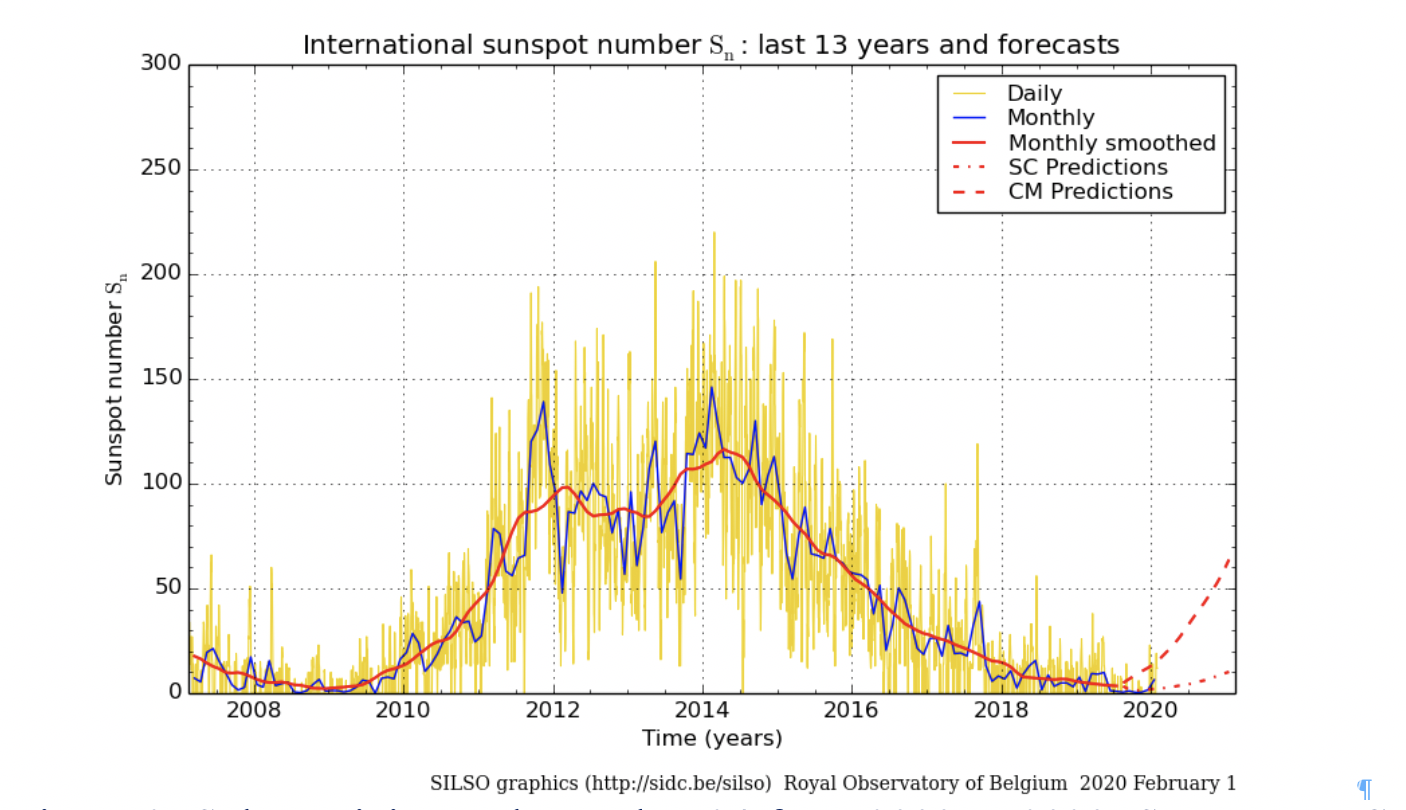
Figure 2: Solar activity cycle number 24 from 2008 to 2020. Source: WDC-SILSO, Royal Observatory of Belgium, Brussels. http://www.sidc.be/silso/home
Figure 2 shows the number of sunspots in solar activity cycle number 24 from 2008 to 2020. The time-variant number of sunspots may be represented by the simple model Ssa(Ssn(), Asa(), Tsa(), Fsa()), where Ssn() represents the solar cycle number, Asa(t) the time-variant amplitude, Tsa() solar activity period time and Fsa() the solar activity period phase state. The solar c¢¢¢ycle 24 has sunspots minima at: Ssa(Ssn(24), Asa(min), Tsa(), (Fsa(2008), Fsa(2020))) in a period of Tsa() = [Fsa(2020)]-Fsa(2008)] = 11 years and a maximum number Ssa(Ssn(24), Asa(max), Tsa(11), (Fsa(2014)) for Asa(max) = 125 sunspot numbers.
If solar cycles have a stationary 11-year period, we may expect an upcoming next solar a maximum and a minimum at the years: Ssa((Ssn(22), Asa(max), Tsa(11), (Fsa(2014 + 11 = 2025)) and Ssa(Ssn(25), Asa(min), Tsa(11), Fsa(2020+11 = 2031)).
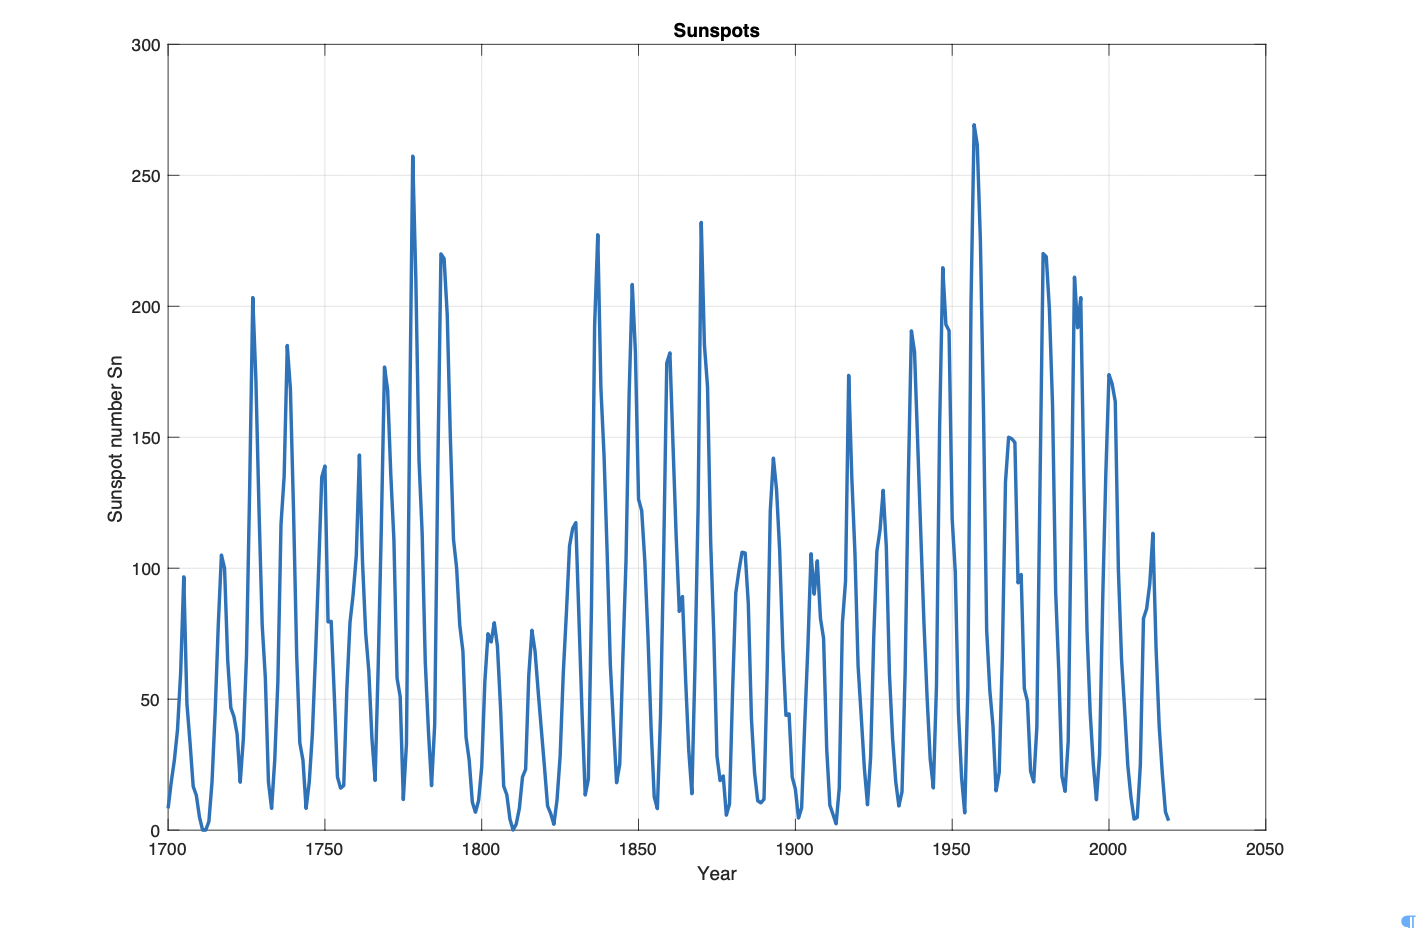
Figure 3: Solar activity from 1700-2020. Source: WDC-SILSO, Royal Observatory of Belgium, Brussels. http://www.sidc.be/silso/home
Figure 3 shows the number of sunspots in the solar activity from 1700 to 2020. In this time period the solar cycle numbers Ssn() have a time-variant maximum number of sunspots Ass(max). The solar cycle number Sn() have smaller Ass(max) close to the years [Fsa(1700), Fsa(1810), Fsa(1910), Fsa(2020)]. These sunspots minima have a possible relation to reduced Total Solar Irradiation (TSI) from the Sun and colder climate on Earth.
1.2 Grand solar minima
As the sunspot data series became longer, it exhibited stationary 11-year periods and sunspot amplitude variability (Schwabe 1844). In the 1890s, G. Spörer and E. W. Maunder (1890) reported that solar activity greatly decreased during a cold period from 1645 to 1715 (Eddy 1974; 1973). Suess (1980) studied the radiocarbon dating of pine tree rings over the past 8,000 years and identified a stationary climate period of approximately 210 years. The 210-year climate oscillation coincided with the Maunder (1640–1720) and Dalton (1790–1820) (Usoskin et al. 2014) minimum solar variability periods, which stimulated speculation about the next possible cold climate period (Velasco and Mendoza 2008; Cliver et al. 1998). An adjustment-free reconstruction of the solar activity over the last three millennia confirms four Grand minima since the year 1000: [Oort (1010–1070), Wolf (1270–1340), Spörer (1390–1550), Maunder (1640–1720), Dalton(1790 – 1820)], (Usoskin et al., 2007). The Grand minima are associated with less solar activity and colder climate periods.
2 Solar Variability
2.1 Stationary solar periods
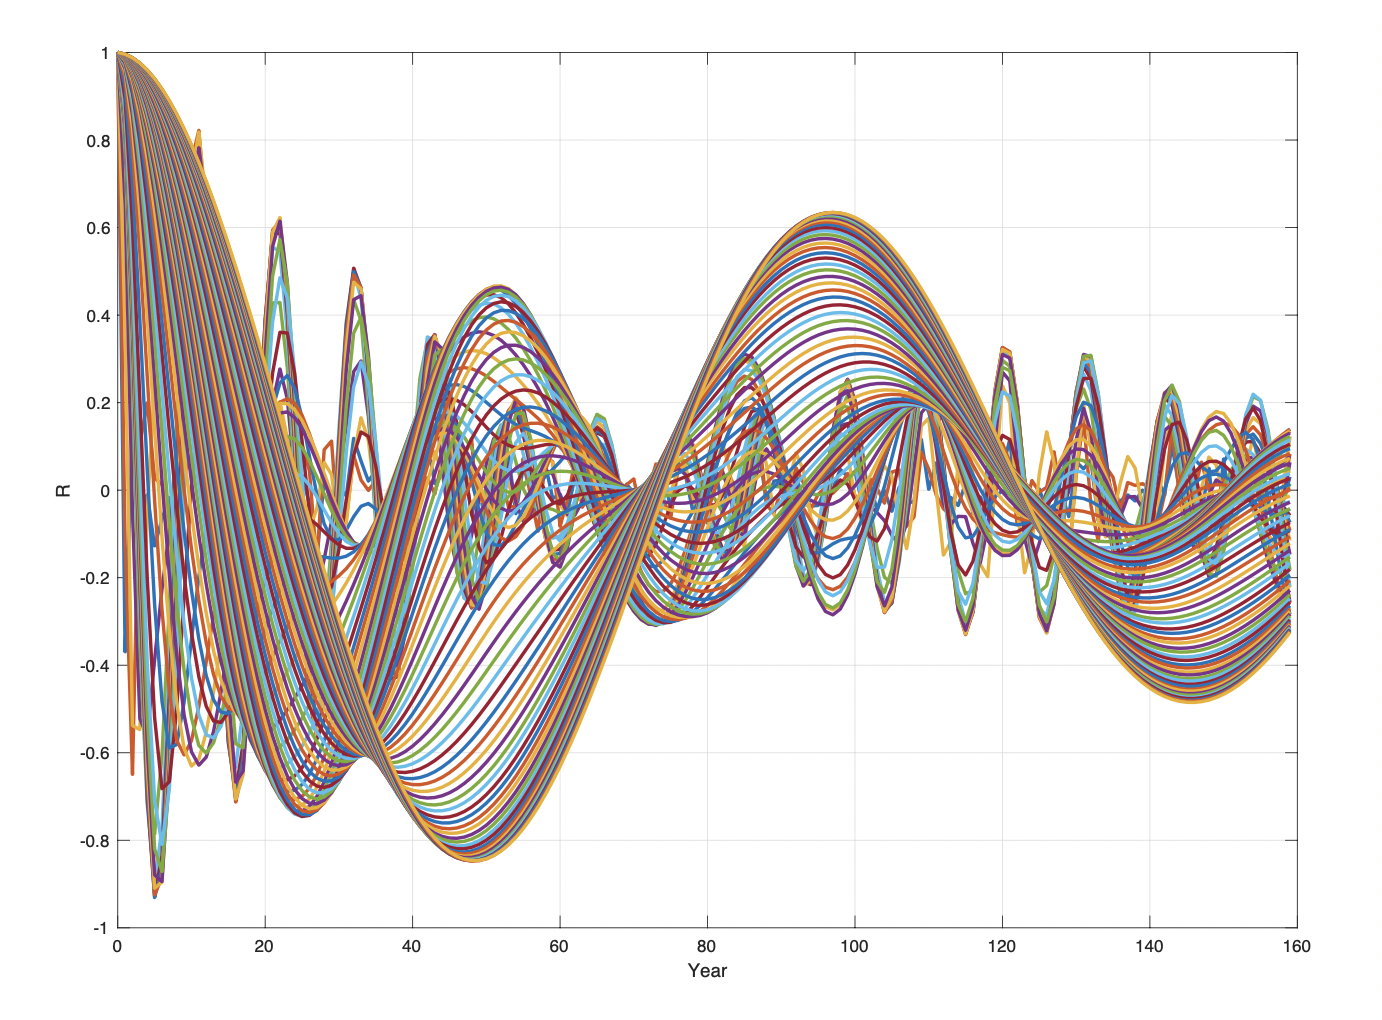
Figure 4. Solar activity wavelet autocorrelation spectrum WAsa(R(s), m) for s = 1…10 and t = 1700…2020.
A wavelet transformation of sunspots numbers Ssn() from 1700 to 2018 (Figure 5) computes a set of correlated periods Wsa(s, t) to a set of moved scaled wavelet pulse function. Stationary periods in Wsa(s, t) are identified by computing the autocorrelations WAsa(R(s), m) [Eq. 4] as shown on Figure 4. The wavelet specter (Figure 4) has maxima period correlations of: WAsa(Rsa, Tsa) = [(0.82, 11), (0.46, 52), (0.63, 96), (0.29, 180), (0.34, 200)]which show a correlation vector Rsa() = [0.82, 0.46, 0.63, 0.29, 0.34] to the stationary close to the periods: Tsa() = [11, 51, 96, 180, 200] (yr.).
2.2 Solar activity coincidence spectrum
The 11-year period has sub-harmonic periods of Wsa(Rsa(s), Tsa) = [(0.60, 11), (0.50, 22)…..], which confirm a stationary sola period close to Tsa(11) years. The identified stationary periods in the solar activity spectrum have sub-harmonic coincidence periods of: [5Tsa(11), Tsa(51)], [8Tsa(11), Tsa(90)], [10Tsa(11), 2Tsa(51), Tsa(110)], [2Tsa(90), Tsa(180)], [2Tsa(110)), Tsa(220)] (yr).
2. 3 Planet period coincidence
The planets Venus, Earth and Jupiter have a [3, -5, 2] coincidence resonance of Tvej = 22.14 years, which confirm a [2Tsa(11), Tvej(22.14)] coincidence between the sola periods and planet periods. The Jovian planets Jupiter, Saturn, Uranus and Neptune have a [7, 3, 1, 1/2] coincidence resonance to identified 11-years period spectrum. Uranus and Neptune have position coincidences of Tu(84.02)*Pn(164.79)/(Tn(164.79)) – Tu(84.02)) = Tun(171.42)) years. Tun(171.42) years and the Saturn period 5Ts(29.447) have a position coincidence period of Tsun(177.77) years, which has a [Tsun(177.77), Tvej(177.12)] coincidence.
The solar-planet periods have sub-harmonic coincidence periods of: [[8Tsa(11), 4Tvej(22.14) = 88.56], [(16Tsa(11), 8Tvej(22.14) = 177.12, Tsun(177.7)], [20Tsa(11), 10Tvej(22.14) = 221.4]. The identified 11-year spectrum has coincidences to the known periods Schwabe (11 years) cycle, Hale (22 year) cycle, Gleissberg (89 year) cycle, solar barycenter Tsun(177.7 year) cycle, Jose (179 year) cycle and the Suss/deVries (210 year) cycle.
2.4 Solar activity variations from 1700
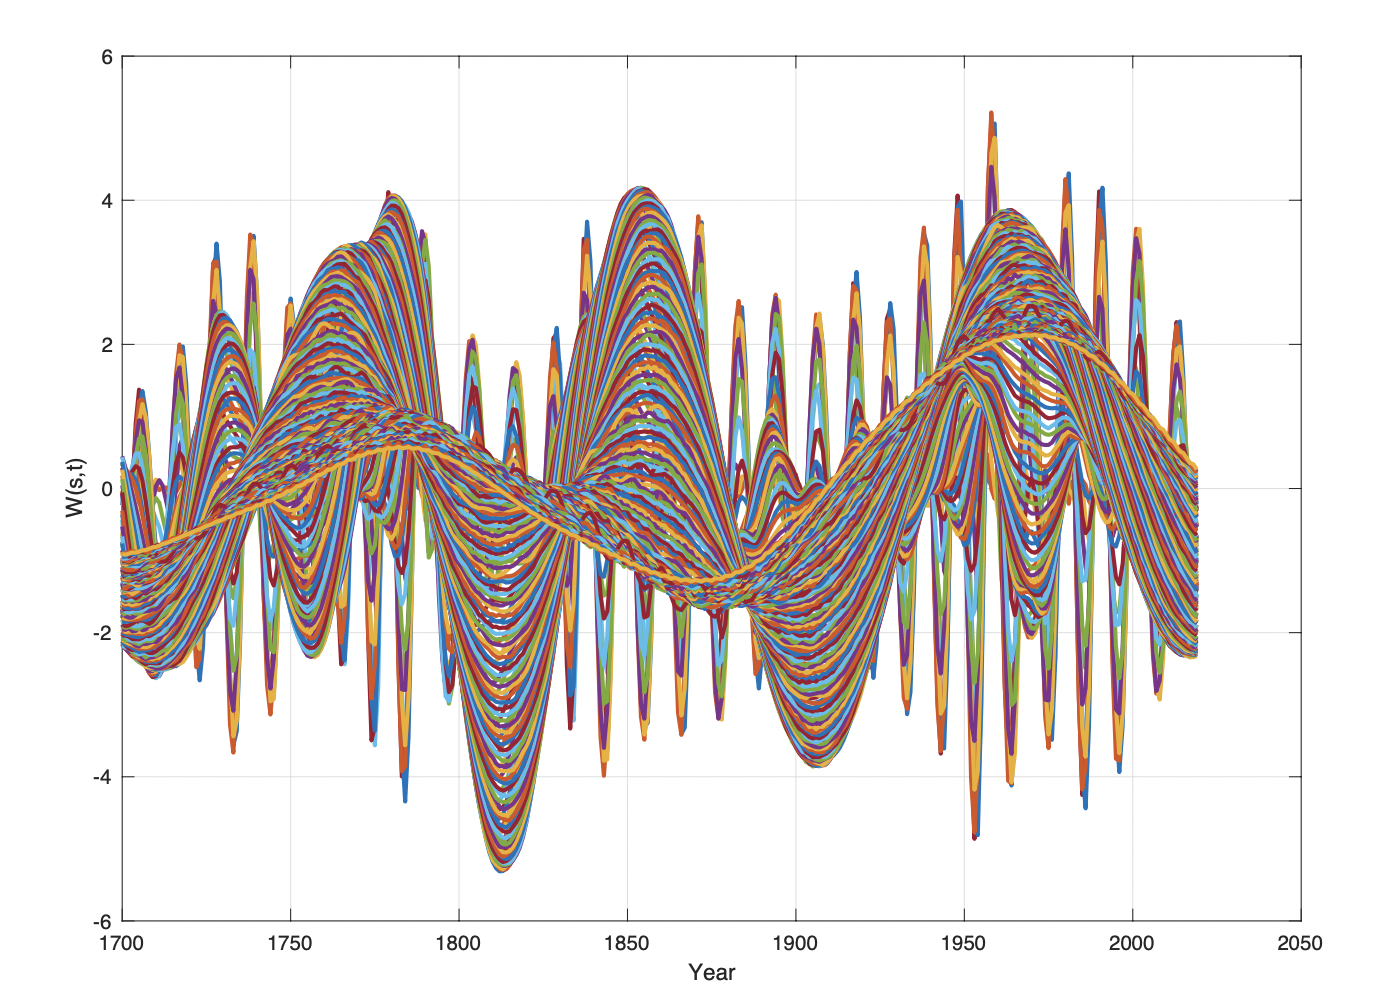
Figure 5. The Solar activity wavelet spectrum Wss(s, t) for s = 1…130 and t = 1700…2020.
The Sunspots data series (Figure 2) is transformed into a wavelet spectrum Wsa(s, t) for s = 1…130 and t = 1700…2020 [Eq. 2] (Figure 5). The dominant period in the wavelet spectrum has amplitude and phase-shifts of: Wsa(s(max/min, 0), Fsa) = [(-0, 1743), (3.3, 1768), (+0, 1793), (-5.2, 1814), (-0, 1831), (4.2, 1854), (+0, 1878), (-3.7, 1908), (-0, 1932), (3.8. 1963), (+0, 2008)]. The wavelet spectrum phase-shifts have mean period of 88 (yr). The longest period has phase-shifts of; Wsa(s(max/min, 0), Fsa) = [(-0, 1740), (0.6, 1782), (+0, 1825), (-1.2, 1869), (-0, 1911), (2.2, 1967)(+0, 2020).
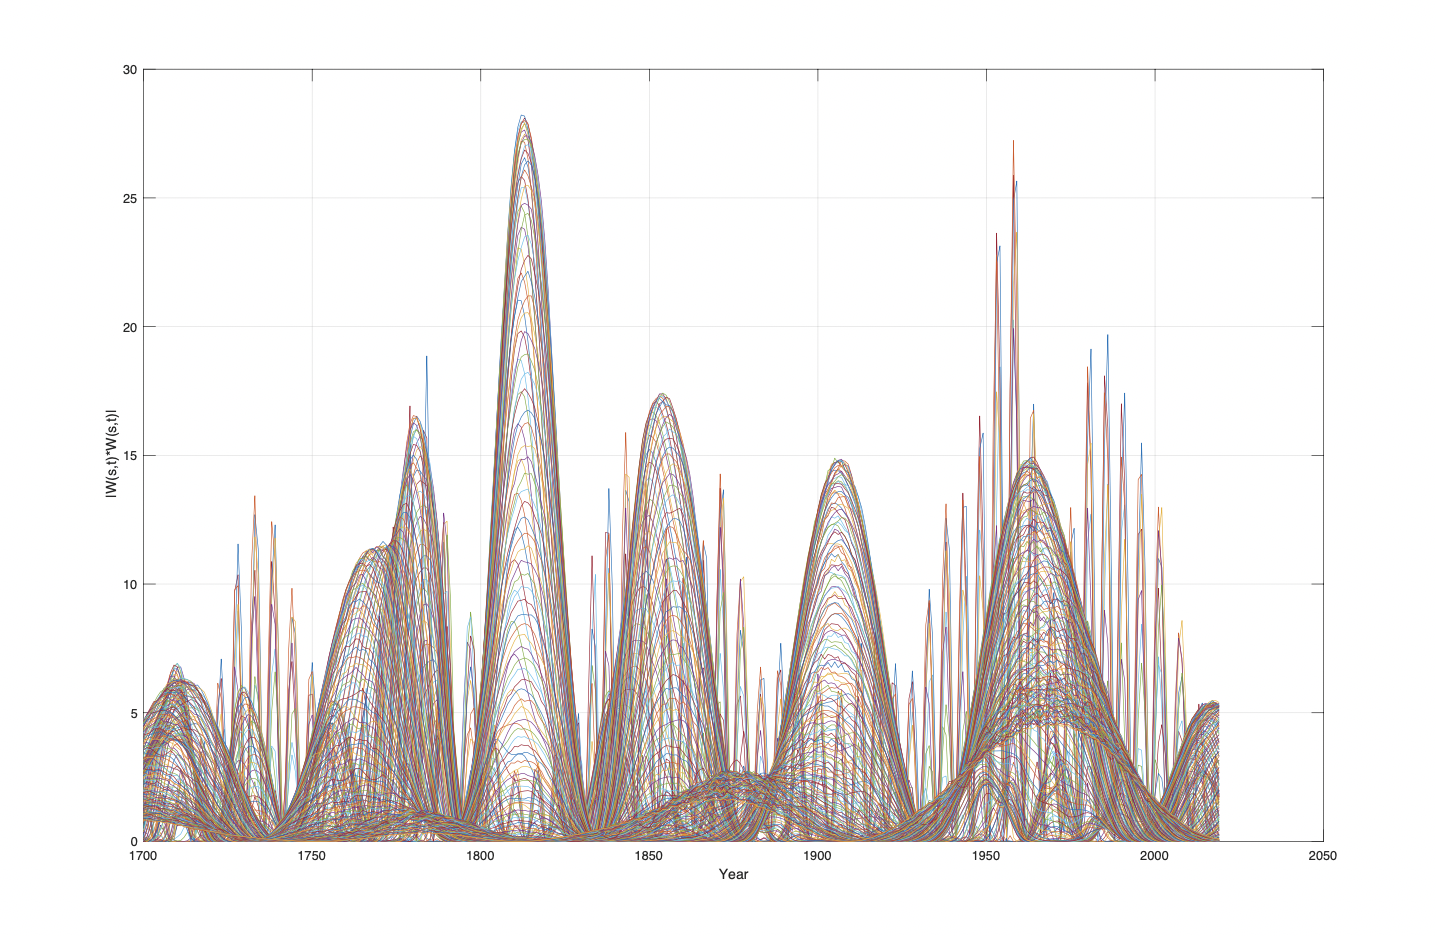
Figure 6. Solar activity wavelet power spectrum WPsa(s(t), t) for t = 1700…2020 and s = 1…130.
The wavelet power spectrum computes the most dominant period in the wavelet spectrum. The sunspots wavelet spectrum Wsa(s, t) is transformed into a wavelet power spectrum WPsa(s, t) as shown on Figure 6. The computed wavelet power spectrum from 1700 to 2020 has a maximum and phase-shifts at the years: WPsa(s(max, 0), Tsa(90), Fsa) = [(-0, 1737), (11.2, 1770), (+0, 1796), (28.2, 1813), (-0, 1832), (17.4, 1854), (+0, 1877), (14.4, 1905), (-0, 1933), (14.8, 1962), (+0, 2015)]. The wavelet power spectrum maximum has phase-shifts of [33, 26, 17, 19, 22, 23, 28, 29, 41] a mean time distance of 22.5 years and confirm mean total wavelet period of Tsa = 4*22.5 = 90.0 years, which confirm the 89-90 year period in solar activity. The longest period has wavelet phase-shifts of: WPsa(Asa(min, 0), Tsa(176), Fsa) = [(-0, 1752), (0.6, 1790), (+0, 1814), (-1.7, 1875), (-0, 1925), (1.9, 1967), (+0, 2015)] distances [38, 24, 61, 50, 42, 48] (yr) in a mean period Tsa() = 175 years, which confirm a 178-year Jose-period in solar activity.
2.5 Grand solar minima coincidences
Stationary periods, in coincidence to planet periods, are expected to have the same periods before 1700 and after 2020. We may then compute the coincidence between the identified [Tsa(90), Tss(175)] solar periods and known Grand solar minima from 1000 A.D., and we may compute expected upcoming Grand solar minima.
Dalton (1790 – 1820) coincidence: Wsa(Asa(0>), Tsa(90), Fsa) = [(+0, 1796), (-0, 1832)] and Wsa(Asa(0>), Tsa(175), Fsa) = [(+0, 1814), (min, 1813), (-0, 1925)] have minima coincidences from Fsa(1814) to Fsa(1832) in a period of 18 years. The period Tsa(175) has a 4 year Grand minimum coincidence from 1814 to 1820, which represents a short coincidence period.
Maunder (1640–1720) coincidence: Wsa(Ass(0>), Tsa(90), Fsa) = [(+0, 1616), (min, 1634), (-0, 1652)] and Wsa(Ass(0>), Tsa(175), Fsa) = [(+0, 1638), (min, 1694), (-0, 1749)] have minima coincidences from: 1638 to 1652 in a time-period of 14 years. The period Tss(175) has an 80 year Grand minimum coincidence from 1640 to 1720. The Tsa(175) period is close to a perfect Grand minimum coincidence.
Spörer (1390–1550), coincidence: Wsa(Asa(0>), Tsa(90), Fsa) = [(+0, 1436), (min, 1456), (-0, 1472)] and Wsa(Asa(0>), Tsa(175), Fsa) = [(+0, 1462), (min, 1506), (-0, 1550)] have minima coincidences from 1462 to 1472 in a time-period of 10 years. The period Tsa(175) has an 88 year Grand minimum coincidence from 1462 to 1550. The Tsa(175) period has a perfect Grand minimum coincidence.
Wolf (1270–1340) coincidence: Wsa(Asa(0>), Tsa(90), Fsa) = [(+0, 1256), (min, 1274), (-0, 1292)] and Wsa(Asa(0>), Tsa(176), Fsa) = [(+0, 1286), (min, 1380), (-0, 1474)] have minima coincidences from Fsa(1286) to Fsa(1292) in a period of 6 years. The long period Tsa(175) has a 54 year Grand minimum coincidence from 1286 to 1340.
Oort (1010–1070) coincidence: Wsa(Asa(0>), Tsa(90), Fss) = [(+0, 1076), (min, 1094), (-0, 1112)] and Wsa(Asa(0>), Tsa(176), Fsa) = [(+0, 1110), (min, 1203), (-0, 1298)], have minima coincidences from 1110 to 1112 in a time-period of 2 years. The long period Tsa(175) has a 60 year Grand minimum coincidence from 1010 to 1070, which is close to the Wolf type Grand minimum.
The computed phase-shifts reveals a close relation between the identified period Tsa(175) and Grand minima from 1000 A.D. A more accurate relation is most likely related to the solar Barycenter period Tsun(177.77) and the period 4Tvej(22.14) = 88.56).
Modern solar maximum coincidence: Wsa(Asa(>0), Tsa(90), Fsa) = [(-0, 1933), (max, 1968), (+0, 1984)] and Wsa(Asa(>0), Tsa(190), Fsa) = [(-0, 1925), (max, 1962) (+0, 2015)] have a 70-year positive coincidence period from 1933 to 1984, which explain a 50-year period of maximum solar activity. The solar activity period Tsa(175) positive state from 1925 to 2015 reveals the end of modern solar maximum at the year 2015 and reveals the beginning of an upcoming next Grand minimum period.
Upcoming next Grand solar minimum: Wsa(Asa(>0), Tsa(90), Fsa) = [(+0, 2073), (min, 2095), (-0, 2117)] and Wsa(Asa(>0), Tsa(176), Fsa) = [(+0, 2015), (min, 2060), (-0, 2103), (max, 2150)] have minima coincidences from the years Fsa(2073) to Fsa(2103) in a period of 30 years. The periods have computed minima at the years [2060, 2096] and a computed Grand deep minimum close to the year 2077 A.D.
3 Discussion
A wavelet spectrum analysis of sunspot group numbers from 1611 identified solar-Uranus period coincidences of [5Tsa(11), (2Tur(84.02)/3 = 56.0), (10Tsa(11), 4Tur(84.02)/3 = 112.0), (20Tsa(11), 5Tn(84.02)/2 = 210.0)]. The Jovian planets Jupiter, Saturn, Uranus and Neptune have a [7, 3, 1, 1/2] coincidence resonance, which confirms a coincidence resonance between the 11-year spectrum and the Jovian planets. (Yndestad and Solheim, 2017). The new information from this investigation is the solar activity coincidence periods of: [[8Tsa(11), 4Tvej(22.14) = 88.56], [16Tsa(11), 8Tvej(22.14) = 177.12, Tsun(177.7)], [20Tsa(11), 10Tvej(22.14) = 221.4]], known as the the Schwabe (11 years) cycle, Hale (22 year) cycle, Gleissberg (89 year) cycle, solar Barycenter (177.7 year) cycle, Jose (179 year) cycle and the Suss/deVries (210 year) cycle.
The implication of the coincidence between solar activity variability and the planet periods is deterministic long periods in the solar activity. We may then compute expected upcoming maxima and Grand minima solar activity. A possible explanation is the coincidence between planet period-phase relations and solar Barycenter periods, which influences the solar dynamo and the solar activity on the Sun surface. The identified 178-year Barycenter period and solar period have a coincidence to known Grand minima from 1000 A.D. confirm a stationary Grand minima period close to the 178-year Barycenter period of the Jovial planets.
The solar activity variability has a coincidence to Total Solar Irradiation and climate periods. An analysis of the ACRIM-HS and ACRIM-LS TSI data series computer TSI solar minimum periods from [(2035-2065), (2045-2070)] and computed deep minima at the years [2049, 2060] (Yndestad and Solheim 2017). This investigation has identified a coincidence between the modern warm period from 1933 to 2015, reduced solar activity period from 2015 to 2103 and a deep solar Grand activity minimum close to 2060 A.D.
References
Yndestad H. (2020). Grand Solar Minima 1000-2100 A.D.
Eddy, J.A., 1976. The maunder minimum. Sci. 192, 1189–1202.
Eddy, J.A., 1983. The maunder minimum a reappraisal. Sol. Phys. 89, 195–207. doi: 10007/BF00211962.
Schwabe, H., 1844. Sonnen-beobactungen im jahre 1843. Astron. Nachr. 21 (495), 233–236.
Hathaway, D.H., 2015, The Solar Cycle, Living Rev. Sol. Phys., 12,(4).
Maunder, E.W., 1890. Professor spoerer’s researches on sun-spots. MNRAS 50, 251–252.
McCracken, K.G., Beer, J., Steinhilber, F., 2014. Evidence for planetary forcing of the cosmic ray intensity and solar activity throughout the past 9400 years. Sol. Phys. 289, 3207–3229. doi:10.1007/s11207-014-0510-1.
Velasco, V.M., Mendoza, B., 2008. Assessing the relationship between solar activity and some large scale climatic phenomena. Adv. Space Res. 42, 866–878. doi:10. 1016/j.asr.2007.05.050.
Usoskin, I.G., et al., 2014. Evidence for distinct modes of solar activity. As& A 562. L10. doi: 10.1051/0004-6361/201423391.
Yndestad, H., & Solheim, J. (2017). The influence of solar system oscillation on the variability of the total solar irradiance. New Astronomy, 51, 135–152. http://doi.org/10.1016/j.newast.2016.08.020
Yndestad, H., & Solheim, J. (2017). The influence of solar system oscillation on the variability of the total solar irradiance. New Astronomy, 51, 135–152 Opens Source, https://munin.uit.no/handle/10037/12421
Hello, this weekend is pleasant for me, for the reason that this time i am reading this impressive educational post here at my home. Alfie Vick Elery
This article is in fact a fastidious one it helps new net people, who are wishing for blogging. Christiane Mario Stavros
Thank you for your great explanations.
Hei igjen.
Jeg gikk innom denne artikkel på blogge din for å sjekke noen tall om Wolf minimum.
Jeg ser da at du har rettet årstall.
Jeg linker ofte til din forskning, og har, selv om jeg er litt treg , memorert årstall.
Mitt spørsmål , eller bønn er enkel.
Kan du når du redigerer, skrive at du har redigert , og dato.
Ps, den siste artikkel om dine metoder var oppklarende .
Selv om jeg nok aldri vil forstå matematikken , forstår jeg tegningene du lager bedre,
Takk for en fantastisk blogg!