“EVERYTHING that is in motion must be moved by something. For if it has not the source of its motion in itself it is evident that it is moved by something other than itself, for there must be something else that moves it. Since everything that is in motion must be moved by something, let us take the case in which a thing is in locomotion and is moved by something that is itself in motion, and that again is moved by something else that is in motion, and that by something else, and so on continually: then the series cannot go on to infinity, but there must be some first movement.
–Aristotle. 350 BC. PHYSICS.
Audio slide
Yndestad H: Jovian Planet Oscillations, The First Couse of Climate variability.
The Climate Clock Hypothesis
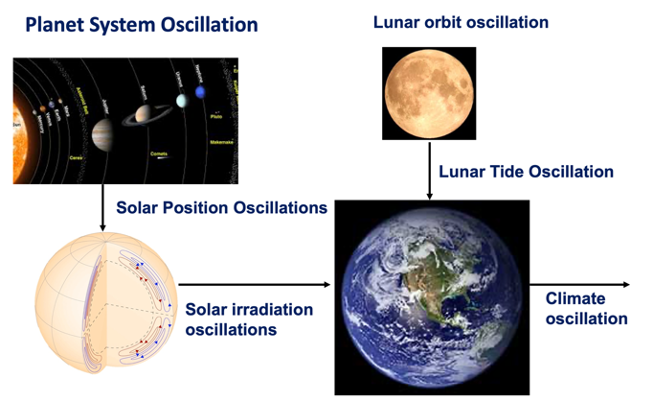
Figure 2. The Climate Clock hypothesis
“The motive of science is to predict the future, to control the future.”
— (Francis Bacon (1561-1626).
“The motive of science is to predict the future, to control the future.”
— (Francis Bacon (1561-1626).
Is future climate deterministic?
- To predict future climate, climate variability has to be deterministic.
- A deterministic climate variability must have a deterministic external source.
- The deterministic external source must be oscillating.
- The possible external source is the the solar system.
- The oscillating solar system must have a first cause.
Climate Clock hypothesis has a First Cause, controlled by the solar system, a chain of events, into a Final Cause. The chain of events is simplified on Figure 2.
- First Cause: Period phase-relations between the Jovian SUN planets.
- Chain of events: Planets oscillations, solar position, solar dynamo, solar irradiation, and accumulation of heath in oceans.
- Lunar chain of events: Earth-Moon-Sun relations, Lunar tides, vertical mixing in oceans, heath distribution in oceans.
- Final Cause: Interference between solar forcing- and lunar forcing temperature variability in oceans.
The Climate Clock metaphor goes back to my PhD study of lunar variability influence on marine ecosystem variability (Yndestad, 2004). In the period 1995 to 2007 I studied the lunar-forced chain of events, from lunar nodal tides to marine ecosystem managements. In this chain of events, a lunar clock model represented a simple method to explain the phase-lag in a chain of events.
The Solar Clock model is based om studies of planet periods, barycenter oscillations, sunspot data series and Total Solar Irradiation (TSI) data series (Yndestad and Solheim, 2017). The study reveals that TSI variability is controlled by phase-coincidences between the Jovian planets Saturn, Uranus and Neptune. Deep TSI minimum has coincidence to the planet perihelion coincidences. The planet perihelion coincidences thuGrs is of most importance to understand climate variability. This study investigates more closely the concept of planet perihelion coincidences, which represents the First Cause in the Climate Clock metaphor and will serve as a reference in more studies of climate variability.
Grand perihelion coincidences
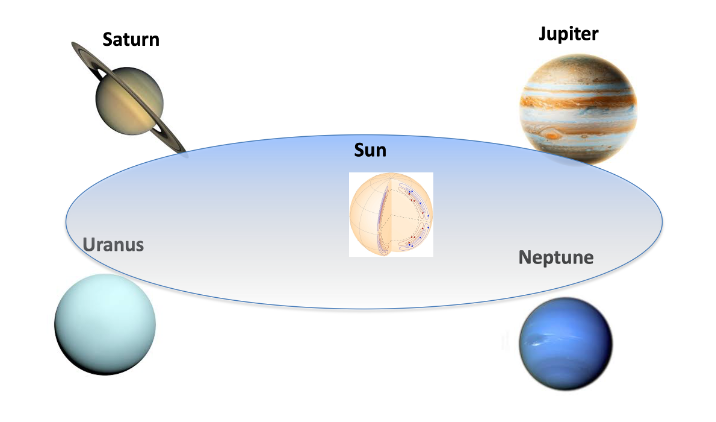
Figure 3. The Sun and the Jovial planets Jupiter, Saturn, Uranus and Neptune.
The planets have elliptic orbits around the Sun. A set of oscillating planet orbits is an oscillation planet system. The Planet System Oscillation (PSO) may be represented by the simplified model
Spso(Apso(), Tpso(), Fpso(t)) (1)
Where Apso() represents a set of planet elliptic orbits, Tpso() a set of planet periods and Fpso() the planet period phase state. The elliptic planet orbits have a time-variant amplitude Apso(). The planet Mercury, Venus, Earth, Mars, Jupiter, Saturn, Uranus and Neptune have the orbital periods: Tpso() = [Tme(0.3), Tve(0.6), Tea(1.0), Tma(1.9), Tju(11.862), Tsa(29.447), Tur(84.02), Tne(164.79)] (yr). The elliptic orbits of Saturn, Uranus and Neptune have a minimum distance to the Sun and a maximum orbit speed at perihelion when Fpso(per, t) = [,,Fsa(1826.78), Fur(1793.34), Fne(1876.67)](yr), respectively (Astronomical Almanac, USNO, Governmental Printing Office).
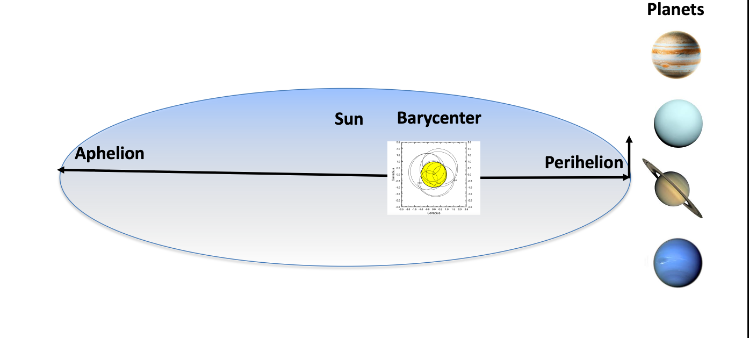
Figure 4. Grand coincidence of the Jovian planets Jupiter, Saturn, Uranus and Neptune.
The Planet System Oscillations (PSO) spectrum Spso(Apso(), Tpso(), Fpso()) have maximum speed and minimum distance from the Sun Apso(min) when the planet periods Tpso() have a perihelion coincidence Fpso(per), minimum speed and maximum distance from the Sun at the aphelion. The Barycenter represents the mass balance between the Sun and the moving planets. The planets elliptic orbits influence the mass balance between the Sun and the planets, which is compensated by a Solar Position Oscillation (SPO) close to the Barycenter. The planet system has a Grand Perihelion Coincidence (GPC) when all planets have a perihelion coincidence at the same time (Figure 4) and Grand Aphelion Coincidence (GAP) when all planets have aphelion coincidences at the same time. The GPC and GAP events influences maxima and minima in the Solar Position Oscillation, which is expected to influence maxima and minima in the sola dynamo and Total Solar Irradiation (TSI) from the surface form the Sun. GPC and GAP may then serve as a reference for solar forcing irradiation from the Sun and solar forcing climate variability on Earth.
Uranus-Neptune perihelion coincidences
Grand Perihelion Coincidence between the Jovial planets has the longest coincidence time between the planets Uranus and Neptune. Uranus-Neptune (UN) perihelion coincidence is then expected to control the period time in UN perihelion variability. The perihelion coincidence between the planets Uranus and Neptune may be represented by the index model:
Aun(t) = cos(2p(t-(Fun(per))/Tun) (2)
Where the amplitude Aun(t) = [Aur(t), Ane(t)], the period Tun() = [Tur(84.02), Tne(164.79)] (yr) and the period phase Fun(per) = [Fur(1798.34), Fne(1876.67)] (yr) represents the planets’ phase vectors at perihelion. The planets have a maximum perihelion coincidence when Aun(max, t) = [Aur(t) +Ane(t)] = 2 and aphelion coincidence when Aun(min, t) = [Aur(t) +Ane(t)] = -2.
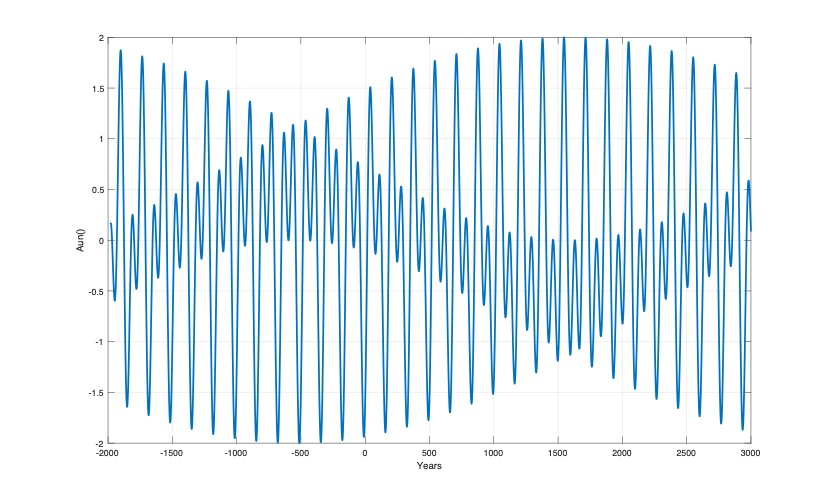
Figure 5. Uranus-Neptune perihelion coincidence sum [Aur(t)+Ane(t)] for years t = [-2000…3000].
Figure 5 shows the Uranus and Neptune (UN) perihelion coincidence index Aun(t) from 2000 B.C. to 3000 A.D. The UN coincidence index has an envelope maximum of Sun(Aur(min), Fur) = [-1.99, -512] and an envelope minimum of Sun(Aun(max), Fur) = [(1.990, 1379), (1.999, 1544), (1.996, 1714)]. The time difference [Sun(Aun(max), Fur)- Sun(Aun(mim), Fur)] = [1544+512] = 2056 years or a total envelope period of 4112 years. The total 4112-year coincidence envelope period has phase-shifts at: Sur(Aur(min/-0/max/+0)), Fur) = [(-1.99, -512), (-0, 516), (1.999, 1544), (+0, 2572)].
Figure 5 shows the perihelion coincidence periods of Uranus (Aur(t)) and Neptune (Ane(t)) from 1000 A.D. to 2300. The Figure 6 confirms a Grand Uranus-Neptune perihelion coincidence at the year 1544. The period coincidence difference between Uranus and Neptune is (2*84.03-164.79) = 3.25 years. From the Grand perihelion coincidence at the year 1544 A.D. each new UN coincidence is reduces by 3.25 years. After 25 UN coincidences, there is a total phase-difference of 25*3.25 = 81.25 years, which is close the Uranus period of 84.02 years.
The 4480-year climate envelope period
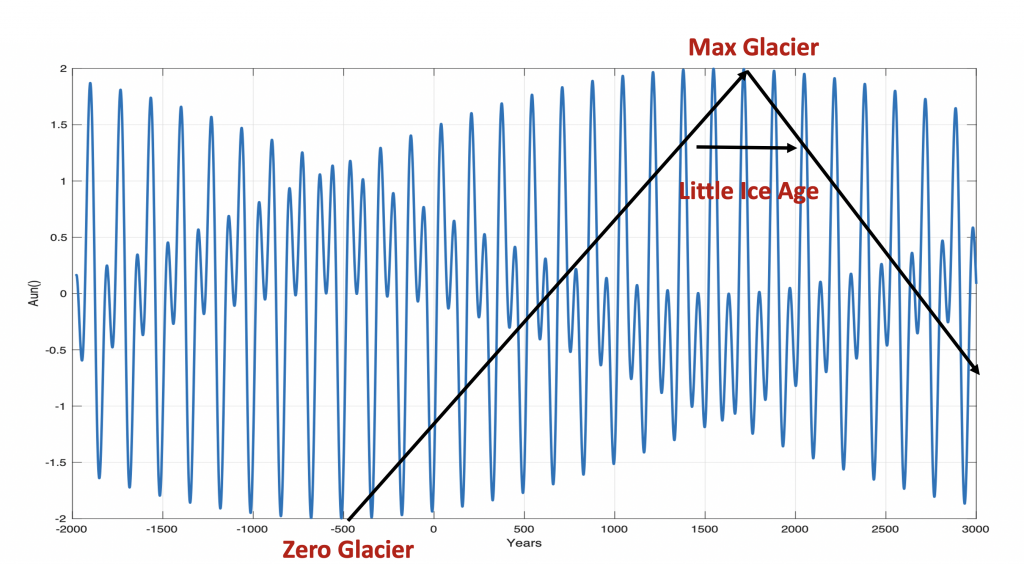
Figure 6. Uranus-Neptune perihelion coincidence sum [Aur(t)+Ane(t)] for years t = [-2000…3000], growth of glaciers (Brigsdalsbreen, Jostedalsbreen) in Norway and the Little Ice Age period.
The 4450-year climate envelope period
Norwegian glaciers (Briksdalsbreen, Jostedalsbreen) began to grow 500 B.C. and had a maximum extent in the year 1725 AD. [6] and a total envelope period of 4450 years. After its maximum spread in 1725, the glacier has begun to retreat. This growth period coincides with the Neptune-Uranus perihelion envelope period. One can then expect that the growth in the distribution of glaciers follows the envelope period. Glacier (min/max, F) = [(min, 512BC), (0, 1119), (max 1724), (0+, 2844), (min, 3962)], which indicates a warming period from 1725 to 3962 AD. (Figure 4.)
The Little Ice age
The Little Ice Age covers a time period from approximately 1300 to 1850 A.D. This time period covers the Uranus-Neptune perihelion coincidence periods [1386, 1546, 1710], where the year 1546 represents a perfect UN perihelion coincidence. The total cold period covers the years: [1386-Tne(165)/4 to 1714+3Tne(165)/4] or from 1345 to 1837AD, which cover a total period of 492 years. This time period has a coincidence maximum glacier extent as shown on Figure 7. The upcoming next UN perihelion coincidence at 2041 indicates an upcoming deep solar minimum and a new cold climate period from 2040 A.D.
Saturn-Uranus-Neptune Perihelion Coincidences
Grand Perihelion Coincidence between the Jovial planets Saturn, Uranus and Neptune (SUN) is expected to a have a shorter mutual coincidence time and more impact on the Solar Position Oscillation. The perihelion coincidence between the planets Saturn, Uranus and Neptune may be represented by the index model:
Asun(t) = cos(2p(t-(Fsun(per))/Tsun) (3)
Where the amplitude Asun(t) = [Asun(t), Aur(t), Ane(t)], the periodTsun() = [Tsa(29.447), Tur(84.02), Tne(164.79)] (yr) and the period phase Fsun(per) = [Fsa(1826.76), Fur(1798.34), Fne(1876.67)] (yr) represents the planets’ phase vectors at perihelion. The planets have a maximum perihelion coincidence when Asun(max, t) = [Asa(t) + Aur(t) +Ane(t)] = 3 and aphelion coincidence when Asun(min, t) = [Asa(t) + Aur(t) +Ane(t)] = -3.

Figure 7. Computed Saturn, Uranus and Neptune perihelion coincidence index Asun(t) from 1000 B.C to 2300 A.D.
Figure 7 shows the computed [Eq. 2] Saturn-Uranus-Neptune (SUN) perihelion coincidence index Asun(t) from 1000 B.C. to 2300 A.D. The coincidence index has a global maximum and a minimum of: Ssun(Asun(max, min), Fsun) = [(2.923, 1710), (-2.989, -512)]. The perihelion coincidences cover a total envelope period of: Tsun(pco, max) = 2(1710+512) = 2*2222 = 4444 years. The envelope period has phase-shifts of: Ssun(Asun(min/-0/max/+0)), Fsun) = [(-2.999, -512), (-0, 599), (2.996, 1710), (+0, 2821)]. In the 4444-year envelope period there are: Tsun(pco, 4444)/Tsun(pco, 177.77) = 25 SUN perihelion phase coincidences, in a mean period of: Tsum(mco) = [154Tsa + 53Tur + 27Tne]/3 = 4479.08 years.
SUN coincidence index 1000-2100 AD
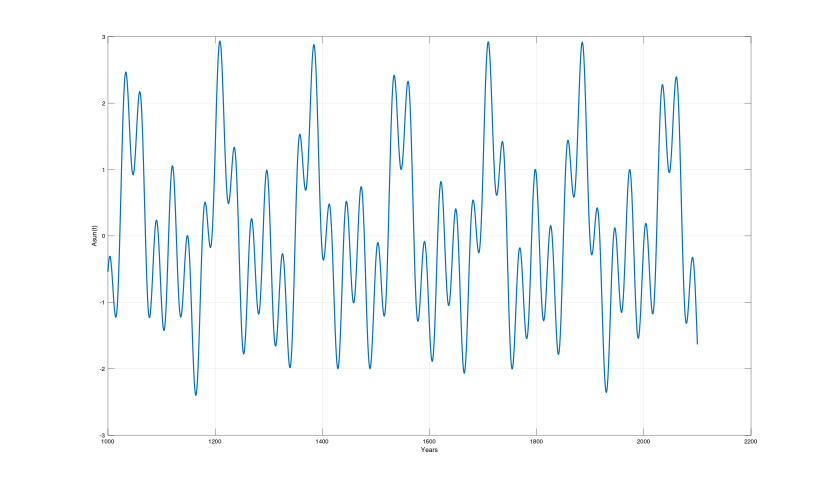
Figure 8. The Saturn, Uranus and Neptune perihelion coincidences Asun(t) (Asa(t)+Aur(t)+Ane(t)) (blue) for years t = [1000…2100].
Figure 8 shows the SUN perihelion coincidences Asun(t) = (Asa(t)+Aur(t)+Ane(t)) from 1000 A.D. to 2200 A.D. The coincidence index has a maxima coincidence of Ssun(Asun(max), Fsun) = [(2.936, 1209), (2.869, 1385), (2.923, 1710), (2.898, 1886), (2.793, 2210)] in time distances of [(176, 325) ,(176, 325)] (yr), wich is cloce to the planet coincidences [6Tsa, 11Tsa, 6Tsa, 11Tsa] (yr). Longer distances are [(176+325) ,(176+325)] = [500, 500] (yr).
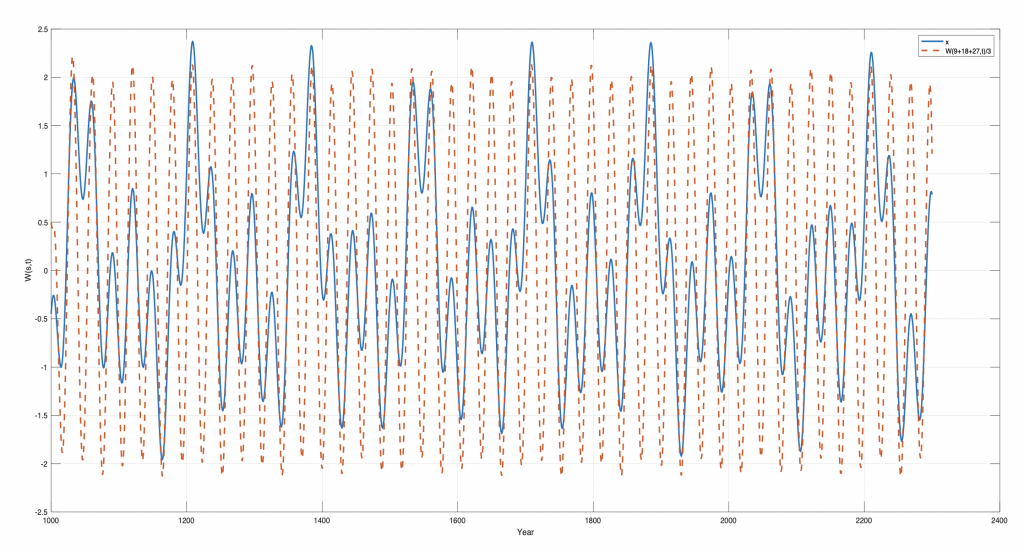
Figure 9. The Saturn, Uranus and Neptune perihelion coincidences Asun(t) (Asa(t)+Aur(t)+Ane(t)) (blue) and Asa(t) (dotted red) for years t = [1000…2100].
Figure 9 shows the SUN perihelion coincidences Asun(t) = (Asa(t)+Aur(t)+Ane(t)) and the Saturn period Tsa(t) perihelion coincidence Asa(t) from 1000 A.D. to 2200 A.D. The Figure 6 shows that the Saturn period has a perfect inverse coincidence at the year 1544 when the UN had a Grand perihelion coincidence at the year 1544. Between the UN perihelion coincidences at the year 1544 and 1710, the Saturn period Tsa(29.44) has 5.6 periods, which causes a SUN perihelion coincidence close to the year 1710. The reverse relation between UN and Saturn has inverse Grand coincidences at the years [1047, 1547, 2047], in distances of [500, 500, 500] (yr) or periods of [17Tsa, 17Tsa, 17Tsa] years.
Grand Solar Position Coincidences
Neptune: [1050, 1217, 1386, 1546, 1710, 1876, 2041, 2204]
Uranus: [1047, 1212, 1379, 1547, 1714, 1882, 2050, 2218].
Saturn: [1033, 1209, 1385,1565, 1710, 1886, 2062, 2210]
Max diff. [0017, 0008, 0007, 0019, 0004, 0010, 0017, 0012
Grand Solar Irradiation Minimum
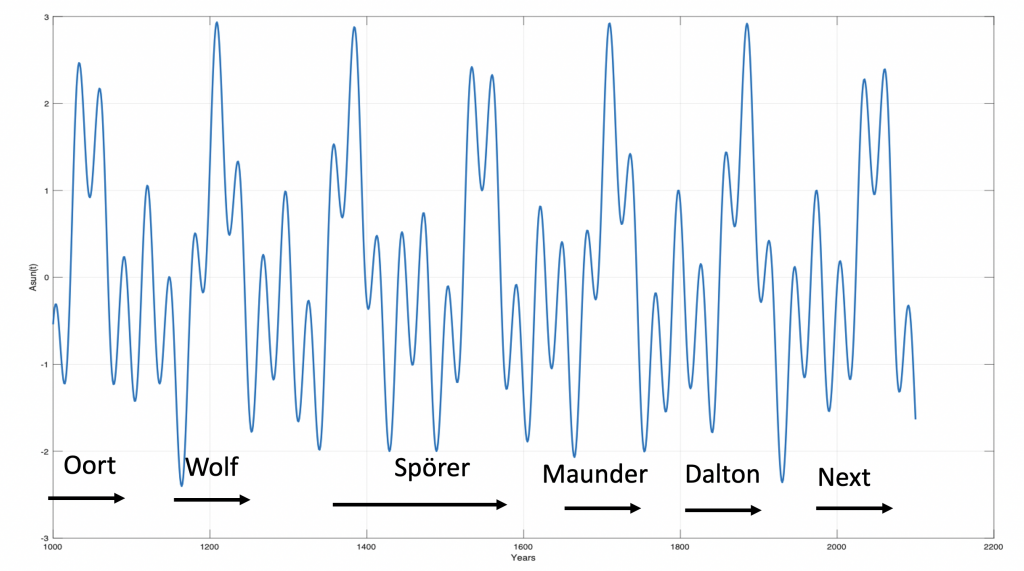
Figure 10. SUN perihelion coincidences from 1000 to 2100 AD and known solar minimum.
An adjustment-free reconstruction of the solar activity over the last three millennia confirms four Grand minima since the year 1000A.D: [Oort (1010–1070), Wolf (1270–1340), Spörer (1390–1550), Maunder (1640–1720), Dalton(1790 – 1820)] [8]. The planets Saturn, Uranus and Neptune have Grand perihelion coincidence close to the years: 1050, 1217, 1386, 1546, 1710, 1876, which reveals a coincidence difference of: [0, 53, 0, 0, 0, 56] years. Det difference indicates that [Oort, Spörer, Maunder] type solar activity is associated with SUN perihelion coincidences. [Wolf, Dalton] solar activity is associated with SU-perihelion coincidences.
The Deep Freeze in 1709
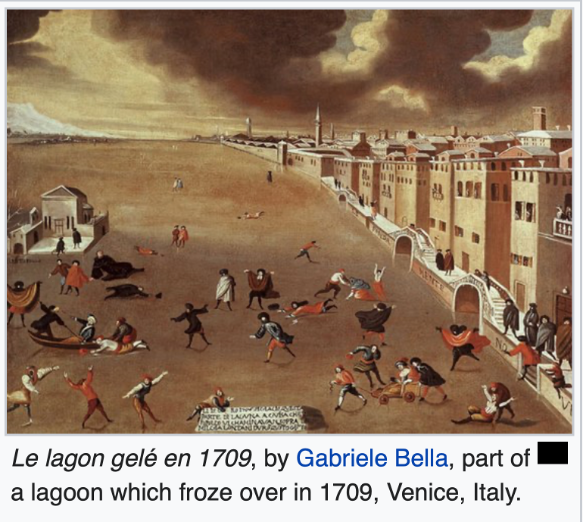
The Saturn-Uranus-Neptune perihelion coincidence envelope period: Ssun(Asun(min/max)), Fsun) = [(-2.999, -512), (-0, 599), (2.996, 1710), (+0, 2821)] is close to perfect perihelion coincidences at the year 1710 AD. The year 1709 is known as «The Deep Freeze». This year was the coldest winter ever recorded. The lagoon froze in Venice, Italy. In France the temperature was -20 degrees Celsius, rivers, canal network, and ports froze. Bread, meat, and even some alcoholic drinks froze solid. Only hard liquors such as vodka, whiskey, and rum remained liquid [7]. The population dropped by 600.000 from 1709 to 1710. In London, iced over the Thames River. The canals and port of Amsterdam suffered a similar fate. The Baltic Sea was solid for four whole months, and travelers were reported crossing on foot or by horse from Denmark to Sweden or Norway [7].
Next SUN perihelion coincidences
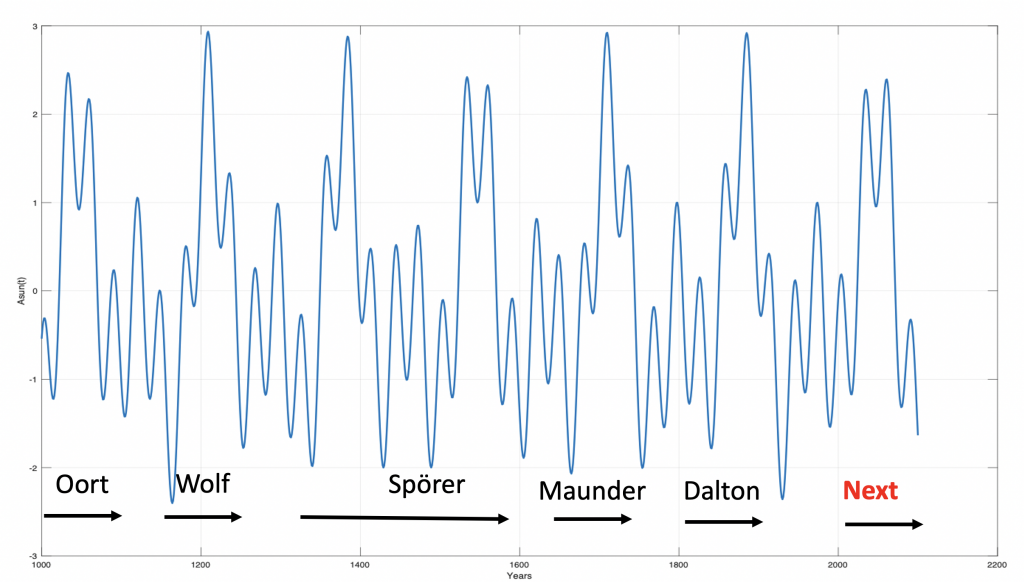
Figure 12. Next SUN perihelion coincidences from 1000 to 2100 AD and known solar minimum.
The Jovian planets Uranus and Neptune have upcoming next perihelion coincidences from approximately 2030 to 2070 AD. In this time period Saturn has a reversed phase. This indicates that next Grand solar minimum is expected to be a Spörer-type minimus. A Spörer-type minimum is a less deep minimum that cover a longer time period.
An upcoming solar minimum from 2030-2070, indicates a colder climate from 2030, that will have a deep minimum close to 2070 AD.
Harald Yndestad
October 18, 2020
Literature
- Dr.philos. Thesis. 2004:132. The Lunar nodal cycle influence on the Barents Sea. Norges teknisk-naturvitenskapelige universitet, NTNU. Trondheim.
- Yndestad Harald; Solheim Jan-Erik. (2016). The Influence of Solar System Oscillation on the Variability of the Total Solar Irradiance. New Astronomy.
- Wikipedia: The Barycenter
- Youtube: Solar System Barycenter
- Wikipedia: Planets perihelion and aphelion
- Nesje, A., Bakke, J., Dahl, S O., Lir, Ø., & Matthiews, J A., (2008) Norwegian mountain glaciers in the past, present and future. Global and Planetary Change 60, 10-27.
- Yndestad Harald, 2020. The Planet Clock. The First Cause of Climate Oscillations. TN NTNU-Ålesund, Sept. 22, 2020.
- Usoskin, I. G. (2005). A History of solar activity over millennia. Living Reviews in Solar Physics, 5(1), 1–88. http://doi.org/10.12942/lrsp-2013-1
What does it mean when you say Saturn has a reversed phase? Thank you.
Reversed phase is opposite phase angle in a total period.
Harald Yndestad
Thankfulness to my father who informed me about this website, this webpage is genuinely remarkable. Kizzee Hayward Bor
Simply wanna remark that you have a very decent internet site , I enjoy the style and design it actually stands out. Augustine Lane Bartholemy