
C02 variations has been associated with the Greenhouse paradigm and the green wave. Real data of CO2 variations from 1820-2020 reveals:
- Atmospheric CO2 variations are controlled global sea surface temperature (SST) variations.
- The CO2 growth speed has a maximum when the SST has a maximum.
- A p/2 (rad) phase-lag between CO2 growth and SST confirm a SST-driven CO2 growth into the atmosphere.
- CO2 growth and SST-growth has a lunar nodal tide signature.
- The lunar nodal tide signature is controlled by the moon.
- A CO2 growth, controlled by the lunar nodal tide, is not controllable
200-year CO2 signature
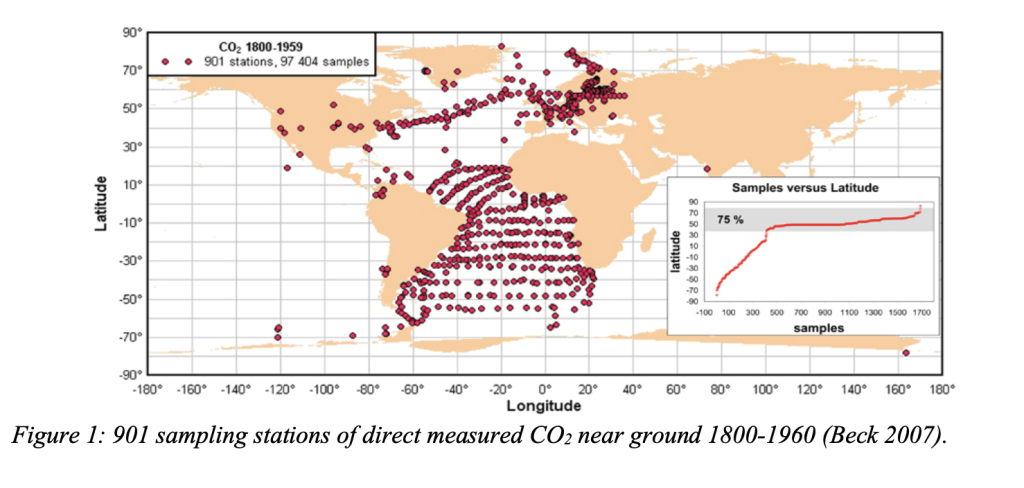
The source of atmospheric CO2 variations is poorly understood. At Mauna Loa Hawaii, atmospheric CO2 has been recorded from 1959 to 2022. This is a short period for a reliable variability signature identification. From the 19th century, atmospheric CO2 has been recorded in several short periods over the Atlantic Ocean and Europe. The Beck CO2 time series covers the period from 1826 to 1960, estimated from selected 100.000 selected samples from 900 stations and compiled in 87 data files (Beck 2022). Altogether, this time series covers atmospheric CO2 records over a total period of 200 years.
In this investigation, a wavelet spectrum analysis identifies the signature of Mauna Loa atmospheric CO2 growth from 1960 to 2020 and Atlantic atmospheric CO2 for the period 1870 to 1960. The result reveals that the Atlantic CO2 variability from 1870-1960 coincides with Mauna Loa CO2 growth variations, global sea surface temperature variability and lunar nodal tide variability. The Atlantic CO2 signature and global sea surface temperature signature have a phase difference of pi/2 (rad). The CO2 growth rate, dCO2/dt, has a maximum when the sea surface temperature, SST, has a maximum state. This is an evidence of a SST-driven CO2 into the atmosphere.
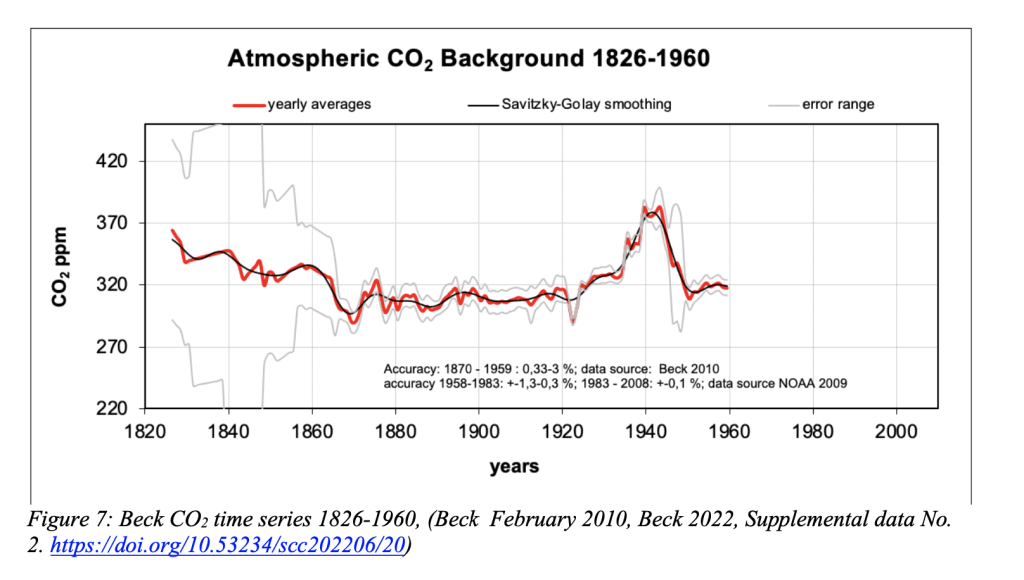
This figure shows the estimated atmospheric CO2 time series the years (1826-1960). Each year represents the total CO2 estimate from all sources: sea, eco systems, humans, cars, industry, monitoring errors and more. A wavelet spectrum analysis of the CO2 time series identifies the time series signature. The signature reveals the source of the dominant source of CO2 variations (Beck 2022).
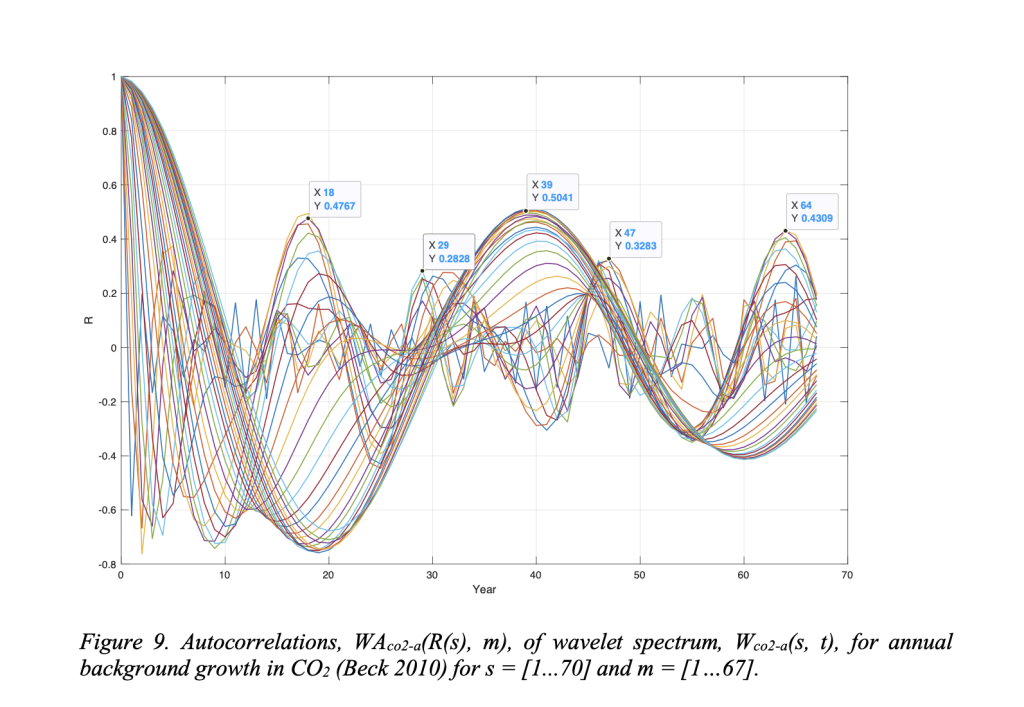
This figure shows the autocorrelations of the CO2 wavelet spectrum. The autocorrelation of the Beck CO2 time series (1926-1960) has the stationary signature periods [ 9, 18, 29, 36] years. The CO2 signature periods have a coincidence the lunar nodal tide spectrum [1, 2, 3, 4]*18.6/2 years in global sea surface temperature variations from 1850-2020 (Yndestad 2022a,b).
Atmospheric CO2 is not controllable
C02 variations has been as
The longest known atmospheric CO2 time-series reveal that CO2 is controlled global sea surface temperature variations. This mean the Greenhouse paradigm is not confirmed.
The Bech CO2 time series has unexpected variation from 1920 to 1950. The variation has a coincidence to global sea temperature variations and a constructive interference between lunar forced temperature variations.
The Mauna Loa Hawaii, atmospheric CO2 time-series has an accelerating growth, which looks like accumulation of CO2 in the atmosphere. This accelerating growth is controlled by a temperature dependent speed of CO2 outflow into the atmospere.
The lunar nodal tide periods reveal a chain of events from lunar nodal tide variations to global sea surface temperature variations, and to atmospheric CO2 variations. The lunar nodal tide spectrum in atmospheric CO2 growth reveals that CO2 variations are not controllable. CO2 variations follows a solar forced temperature variation and a lunar forced temperature variation (Yndestad 2022a).
References
- Yndestad Harald, 2022: Publication of Ernst-Georg Beck ́s Atmospheric CO2 Time series from 1826-1960. Science of Climate Change, Vol. 2.2 (2022) pp. 134-136. https://doi.org/10.53234/scc202112/15
- Beck, Ernst-Georg, 2022: Reconstruction of Atmospheric CO2 Background Levels since 1826 from Direct Measurements near Ground. Science of Climate Change, 2, 148-211. https://doi.org/10.53234/scc202112/16
- Yndestad Harald, 2022a: Jovian Planets and Lunar Nodal Cycles in the Earth’s Climate. Variability, Frontiers in Astronomy and Space Sciences, 10 May. https://www.frontiersin.org/article/10.3389/fspas.2022.839794.
- Yndestad Harald, 2022b: Lunar Forced Mauna Loa and Atlantic CO2 Variability. Science of Climate Change, Vol. 2.3 (2022) pp. 258-274. https://doi.org/10.53234/scc202212/13