Greenland temperature (GISP2) variability is controlled by lunar nodal cycle periods of (1, 4, 8, 16, 24)18.6 years and solar forced periods of (166, 333…4450) years [1]. Cold climate periods in “The Little Ice age” has coincidences to lunar forced periods of 445 years and solar forced periods of (333, 4450/2, 4450) (yr.). (Yndestad H. 2020. https://doi.org/10.3389/fspas.2022.839794).
Greenland temperature from 2000 BC to 2000 AD
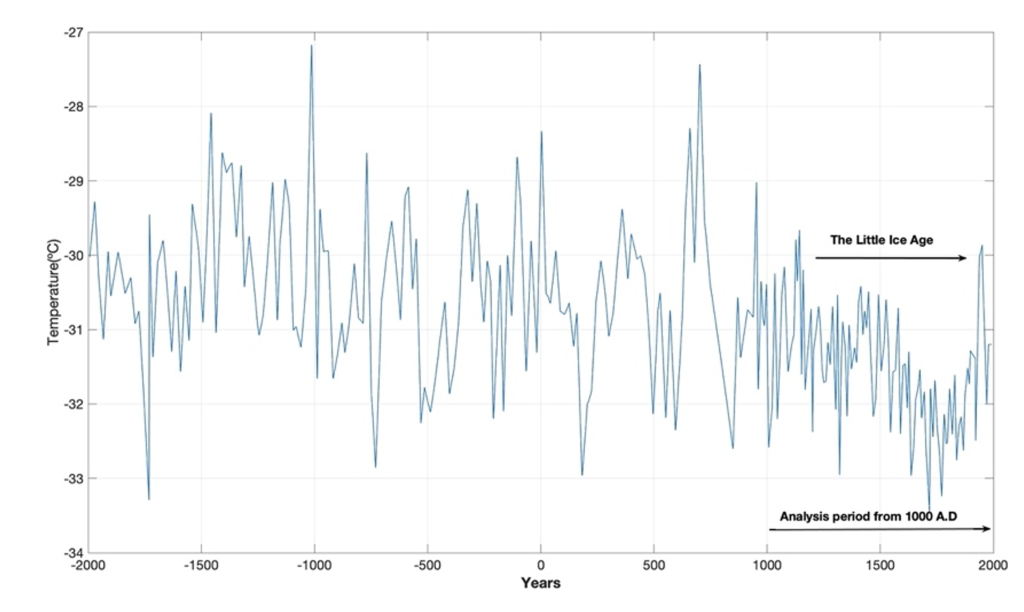
Figure 1. Greenland temperature (GISP2) from 2000 BC to 1993 AD.
Figure 1 show the Greenland temperature from 2000 BC to 1993 AD. The temperature variability looks random from 2000 BC to 1000 AD. From 1000 AD the temperature is reduced to a minimum at 1500 AD., known as “The Little ice age”, the coldest periods in 4000 years. From 1500 to 1993 AD the temperature is recovering to a normal state [1].

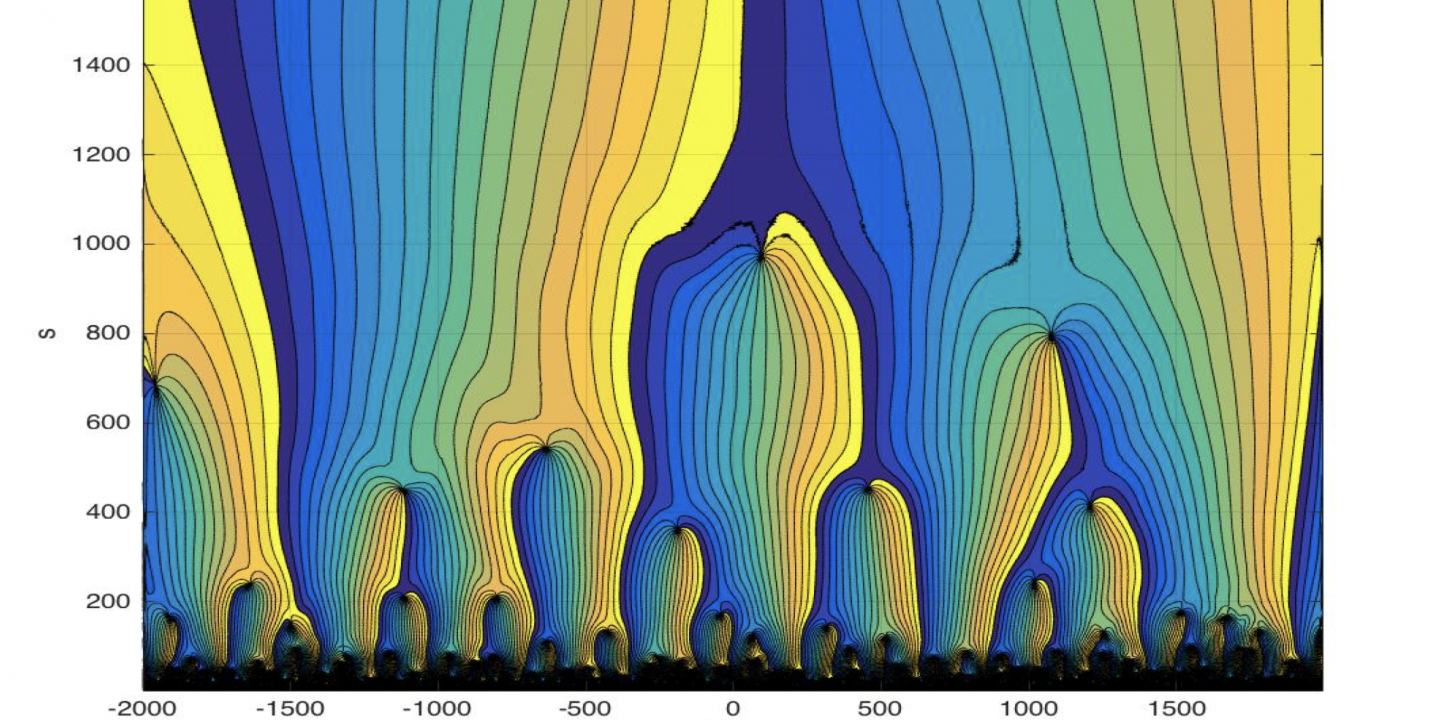
Figure 2. Greenland’s GISP2 temperature wavelet spectrum, WPgrt (s, t), for t = (−2000 . . . 1993) (yr.) and s = (1…2000). The wavelet power spectrum shows dominant warm time periods and cold time periods from 2000 BC.
A wavelet represents moving correlations between a data series and a wavelet impulse function. Wavelet spectrum is represented by a set of scaled wavelets. Figure 2 shows Greenland’s GISP2 temperature wavelet spectrum, Wgrt (s, t), for t = (−2000…1993) (yr.) and s = (1…2000). The wavelet spectrum shows dominant minima and maxima at Wgrt(s=min/max, t) = [(14.0, -1305), (-12.0, -630), (12.0, 595), (-19.0, 1620)].The wavelet spectrum reveals warm maxima at the years (-1356, 595) and cold periods at the years (-630, 1620), in a mean period of 2250 years.
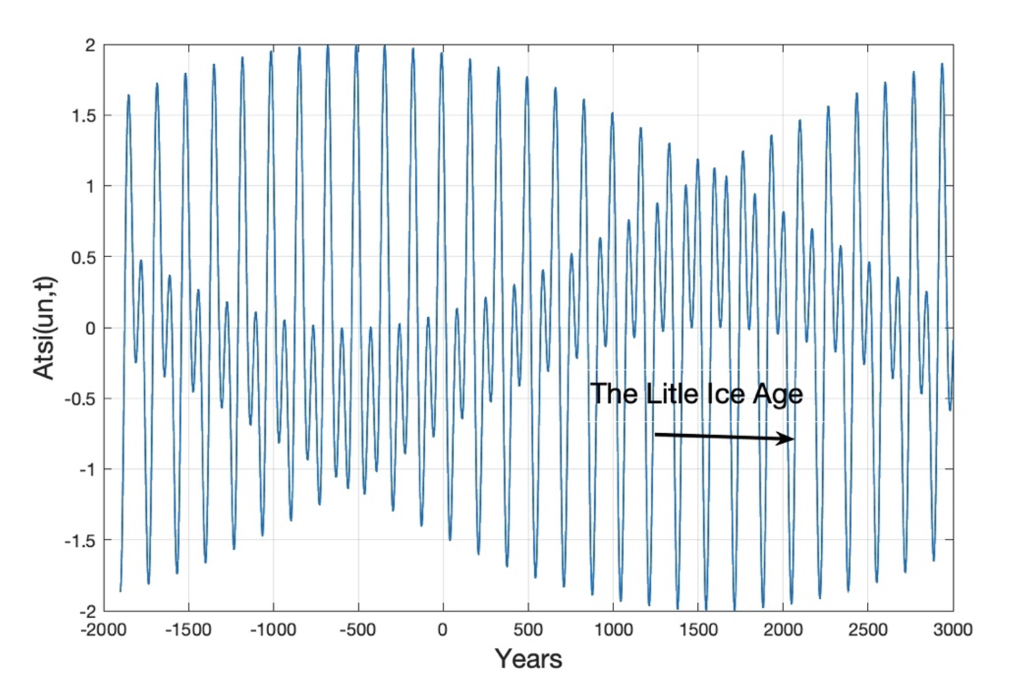
Figure 3. Constructive and destructive interference between Uranus-Neptune forced Total Solar irradiation periods, for the years t = (−2000…3000). “The Little ice age” covers the six constructive Uranus-Neptune minima.
Constructive and destructive interference between Uranus-Neptune forced Total Solar irradiation periods, for the years t = (−2000 . . . 3000) is show on Figure 3. “The Little Ice Age” covers the six deepest Uranus-Neptune minima coincidences in period distances of 166 years [1]. The envelope period has a cycle period of 4450 years, a global maximum at the year 600 and a global minimum at the year 1658. The coincidence difference between the deterministic Uranus-Neptune maximum constructive interference (Figure 3) and estimated Greenland temperature wavelet maxima and minima are 5 and 38 years.
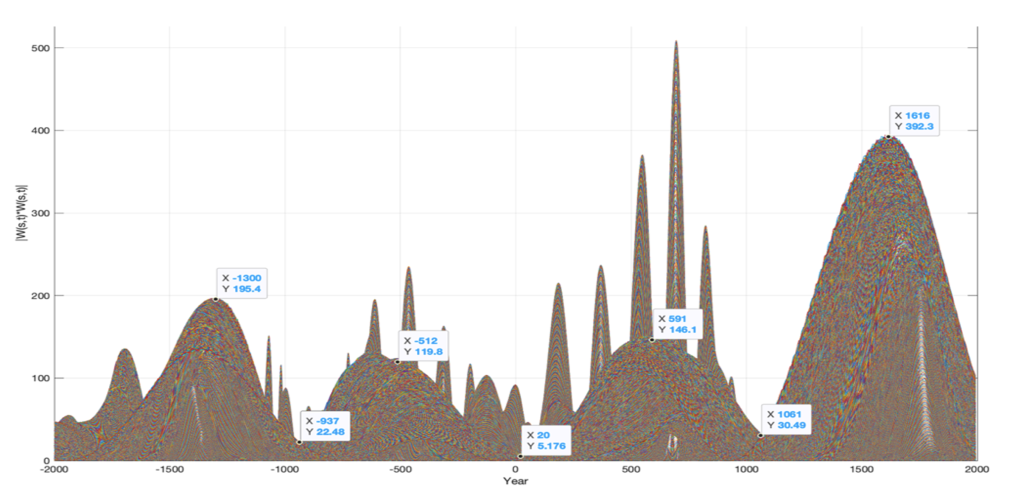
Figure 4. Greenland’s temperature (GISP2) wavelet power spectrum, WPgrt (s, t), for t = (−2000 . . . 1993) (yr.) and s = (1…2000). The wavelet power spectrum shows dominant warm time periods and cold time periods from 2000 B.C.
A wavelet power spectrum, WP(s, t) = W(s, t)*W(s, t), reveals the most dominant periods in the wavelet spectrum. From 2000 B.C., Greenland’s temperature wavelet power spectrum WPgrt(s, t), for t = (-2000 … 1993) (yr.) and s = (1…2000) has maxima of: WPgrt (s = max, t = t0) = ((200, −1300), (120, −513), (147, 585), (392, 1620)), where the years -513 and 1620 represent maxima in cold climate periods. (Figure 4). The time-period spanning from 513 B.C. to 1620 A.D. covers a total period of 2133 years. The stationary temperature cycle has computed phase shifts in the years: Wgrt(t = (t1, t0)) = ((min, −513), (max, 554), (+0, 1086), (min, 1620), (−0, 2153), (max, 2686)).
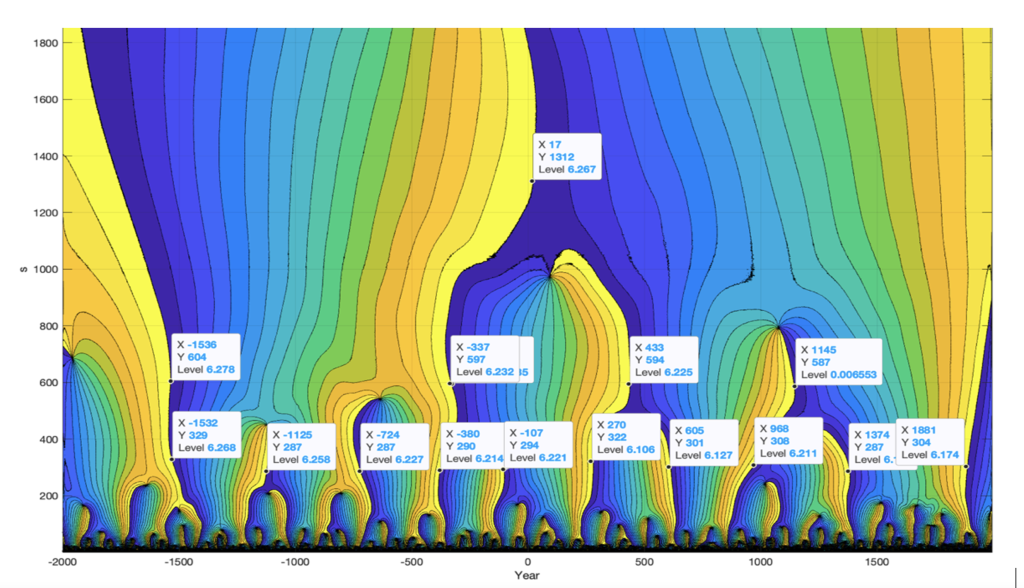
Figure 4 Greenland’s GISP2 temperature wavelet phase spectrum, WFgrt(s, t), for t = (−2000…1993) (yr.) and s = (1…2000). The wavelet phase spectrum shows phase shifts when wavelets (s) have phase shifts at 0 (rad), from 2000 B.C.
A wavelet Phase spectrum, WF(s, t), reveals years when wavelet periods (s) have a phase shift at 0 (rad). From 2000 B.C., the long 2000-year period has a computed phase-shift close to the year 17. From -500 wavelets have phase shifts at the years (-337, 433, 1145), in a mean period of 741 years. Whish are temporary periods in total period of 3*741 = 2223 years.
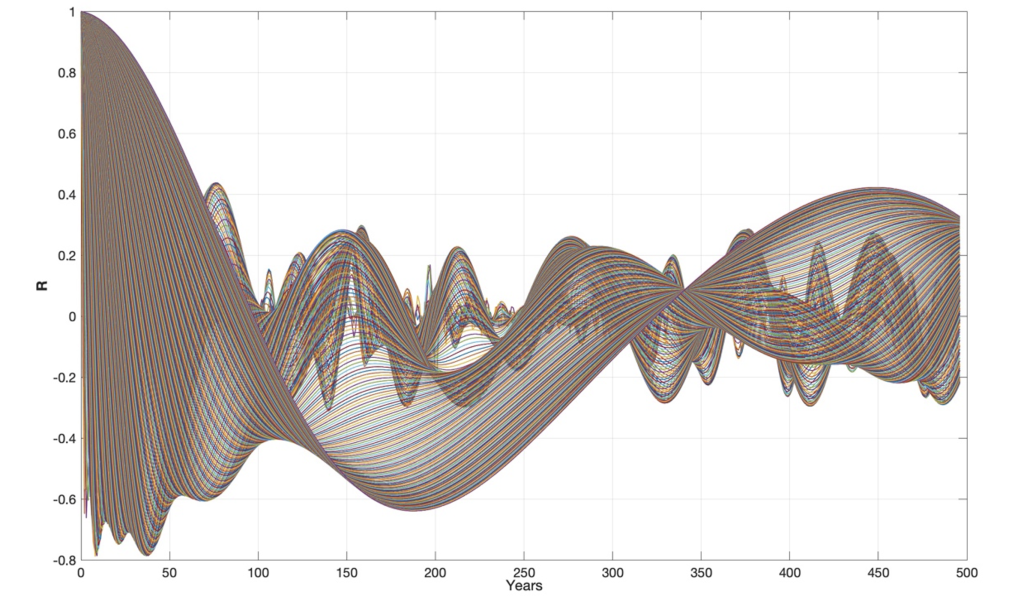
Figure 5. Greenland’s temperature (GISP2) wavelet autocorrelation spectrum, WRgrt(Rgrt(s), m), for s = (1 . . . 500) and m = (1…500) (yr.).
A wavelet autocorrelation spectrum, WA(s, m), reveals stationary cycle periods, harmonic cycle periods and interference periods in the wavelet spectrum W(s, t). Figure 5 depicts the Greenland temperature (GISP2) wavelet autocorrelation spectrum: WRgrt(Rgrt(s, m), of the wavelet spectrum: Wgrt(s, t) for s = (1…500) and m = (1…500) (yr.). The wavelet autocorrelation spectrum, WRgrt(Rgrt(s, m), starting the year 1000, has maxima correlations to the cycle periods: Tgrt = (18, 76, 147, 296, 334, 375, 446) (yr.), where the cycle periods (18, 76, 147, 296, 375, 447) have coincidences to the lunar nodal cycle periods (1, 4, 8, 16, 24)18.6 (yr.) and 334 has a coincidence to the 333-year solar forced period [1].
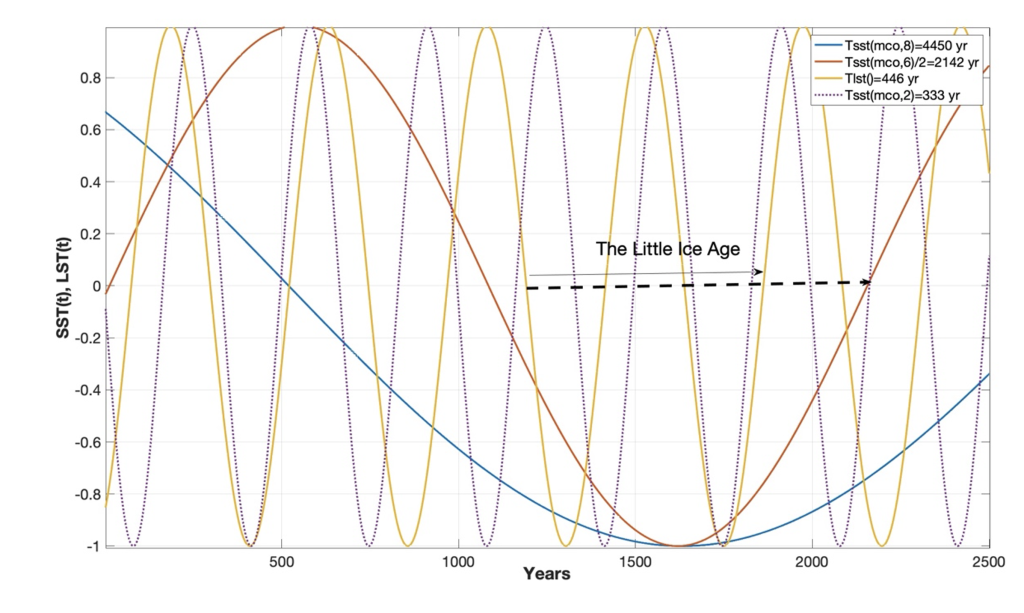
Figure 6. Stationary solar forced sea temperature cycler of (4450, 2142, 333) (yr.) and lunar forced temperature period of 446 years in the years t = (0…2500).
The 332-year solar forced cycle and the 446-year lunar forced cycle have positive constructive interference in the years (165–320), destructive interference in the years (600–1160), and negative constructive interference in years (1330–1420) and (1660–1825). The solar-lunar cycle periods have a computed upcoming negative constructive interference from the year 2085 to 2150 (Figure 6). Temporary negative constructive interference between the identified solar-lunar cycles indicates that “The Little ice age” covers a total time-period of 820 years from 1330 to 2150 AD.
References
[1] Yndestad H. 2020. Jovian Frontiers in Astronomy and Space Science Planets and Lunar Nodal Cycles in the Earth’s Climate Variability. https://doi.org/10.3389/fspas.2022.839794).
[2] Yndestad H: The Earth’s Climate Variability. https://www.climateclock.no/2022/04/28/jsun/
[3] Yndestad H: Lunar forced Global warming. https://www.climateclock.no/2021/03/09/lunar-climate/
[4] Yndestad H: «THE DEEEP FREEZE” https://www.climateclock.no/2021/09/06/the-deeep-freeze-den-kaldeste-vinter/
Dette må jeg lese flere ganger. Jeg prøver å forstå å sette i sammen informasjon jeg får tak i, og rett før jeg fant dette, leste jeg noe som opprinnelig stod på Curry sin blogg.
https://wattsupwiththat.com/2022/08/23/the-sun-climate-effect-the-winter-gatekeeper-hypothesis-iv-the-unexplained-ignored-climate-shift-of-1997/
Denne artikkelen forteller om mye av det du skriver om, men så detaljert at jeg med folkeskole og yrkesskole neppe absorberer alt. Artikkelen går som deg inn på månen og solaktiviteten sin påvirkning av klima.
En ny ting er jeg blitt klar over den siste tiden, jorda forandrer rotasjons hastighet, og en påstand, muligens på forskning.no, hevdet at dagene var lengre for ca 2000 år siden, og om jeg oppfattet riktig, timer i forskjell.
Er dette sant, og hva kan en økt lengde på døgnet ha betydd for klima?
Om Milosevic sykluser ikke bare endrer jord banen, men også rotasjon hastighet, hvil det i det hele tatt bety noe, utenfor Canada i fjor presset havstrømmene styrt av la Niña varmt vann inn mot Canada og nordlige USA i vest tidlig I juli , dette skjer ofte ved La Niña men som regel seinere på året.
Lengre dager ga varme rekorder som fikk alarmistene til å gå i fistel.
To timer Lengre dager gjorde at det ble rekord varme på grunn av at fenomenet oppsto tidligere på året enn vanlig.
Derfor begynner tankene å spinne om at Lengre dager i tillegg til at Milosevic syklusen ble rund på de andre presesjoner er med på å skape mellomistider?
Og igjen, takk for en blogg jeg må få med meg.
Finn Olav
Forklaringen er at endring i gravitasjon fra månen fører til at jordaksen slingrer med en periode på 18.6 år (earth nutation)
Slingringen i x-retning påvirker jordens rotasjons hastighet og lengden på døgnet
Slingringen i y-retning gir en stående tidevannsbølge mellom pol og ekvator, som så påvirker klimaet.
Dette har jeg beskrevet i en rekke artikler
HY