
In nature, nothing acts alone. Therefore, something outside the cod stock, causes recruitment in periods of 6 years. The source may be a 6-year temperature cycle in the Barents Sea. If the temperature in the Barents Sea has a period of 6 years, it must also have a source outside the Barents Sea. This means that there must be a first cause. A cause of causes, for temperature variations in the Barents Sea.
So, what is periodic in nature? Could the source be the tides or in the earth’s rotation? I contacted an astrophysicist. He was not familiar with a 6-year cycle. But says that there is a period of 18.6 years in the earth’s rotation. At the same moment, I imagined a possible explanation. The 6-year period can be a 3rd harmonic period. If the temperature in the Barents Sea has a period of 18.6 years, the biomass will be able to adapt to a temperature variation of 18.6 years, by recruiting in periods of 18.6/3 = 6.2 years.
The sea temperature in the Kola section
I e-mailed PINRO institute in Murmansk. The question was whether they have temperature records from the Barents Sea. To my surprise, I immediately got back a temperature data series monitored in the Kola-section. Russian scientists have been measuring the temperature at the Kole-section, every month, for 100 years. Except during the Russian Revolution and during World War II. Now, this was the world’s longest oceanographic data series. Thanks to their work, I could get an answer to the riddle of a 6-year cycle in the cod population. The problem was that, until now, no one had found anything but random variations, in this temperature data series.
Scientific management
At the beginning of the 20th century, ICES (International Council for the Exploration of the Sea) was established. This was a pioneering work for international Atlantic cooperation on oceanographic and marine research. The secretariat was located to Copenhagen. Marine research in Bergen was established to calculate the basis for marine ecosystem management. One of the initiators of ICES was the Swedish oceanographer, Otto Pettersson. He established research groups in Aberdeen and in Murmansk. Aberdeen, to measure warm North Atlantic water inflow through the Scotland-Faroe Islands strait and to the Norwegian Sea.
PINRIO institute in Murmansk started measuring the inflow of warm North Atlantic water through the Kola-section in the Barents Sea. It was well known, even then, that there was a direct connection between sea temperature and Barents Sea ecosystem growth. The motive for measuring temperature in the Kola-section was to lay a foundation for a scientific management of ecosystem resources. Scientific management is based on the simple idea of compute future biomass, to control future biomass. The problem is to compute future biomass.
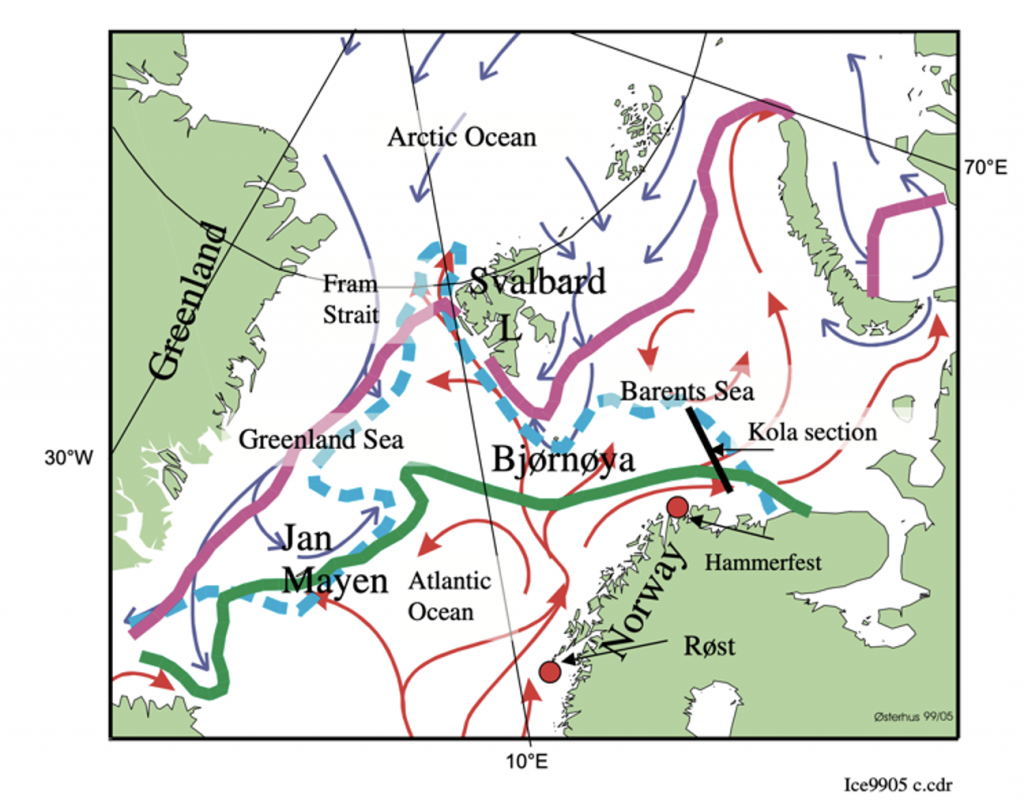
Figure 1 The Barents Sea and the Kola section.
After nearly 100 years of temperature monitoring, the Kola-section (Figure 1) was the world’s longest continuous oceanographic data series. Hundred years of temperature variations were an indicator of Arctic climate and marine ecosystem growth. It revealed large climate variations. At the same time, it was easy to reveal past connections between temperature and marine ecosystem variations. Norwegian and Russian researchers had analyzed the Kola-section data series, without finding anything but random variations. This led to considering the Barents Sea temperature as a result of random wind-driven events. When the sea temperature looks random, events, marine ecosystems look random.
The Kola section data series
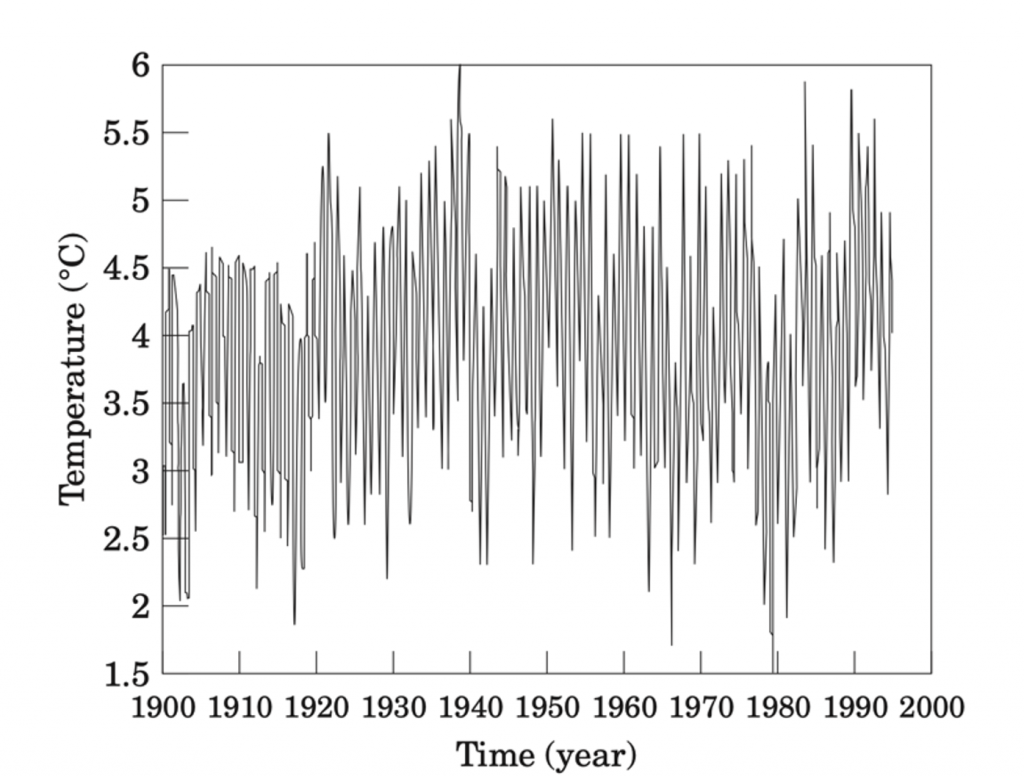
Figure 2. The Kola section data series month from 1900 to 1995.
Figure 2 shows the monitored Kola section temperature in the Barents Sea from 1900 to 1995. The temperature has large annual variations. Before the data series can be analyzed, the annual seasonal variations must be removed. This is done by first calculating the Fourier spectrum.
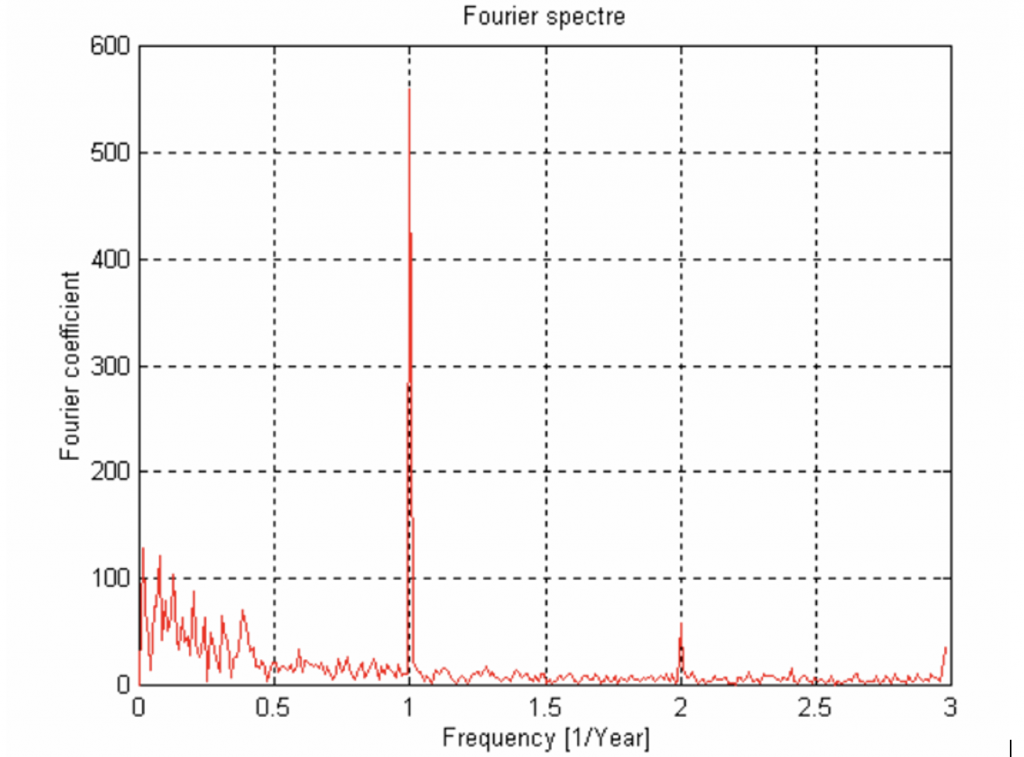
Figure 3. The Fourier spectrum of the Kola section temperature each from the year 1900 to 1995.
Figure 3 shows the Fourier spectrum of the Kola section temperature from 1900 to 1995. It shows that the temperature has a dominant period of one year. The source of the biggest variations are thus annual variations. This information is deleted by setting this frequency period to zero and perform an inverse Fourier transformation back to the Kola-section temperature.
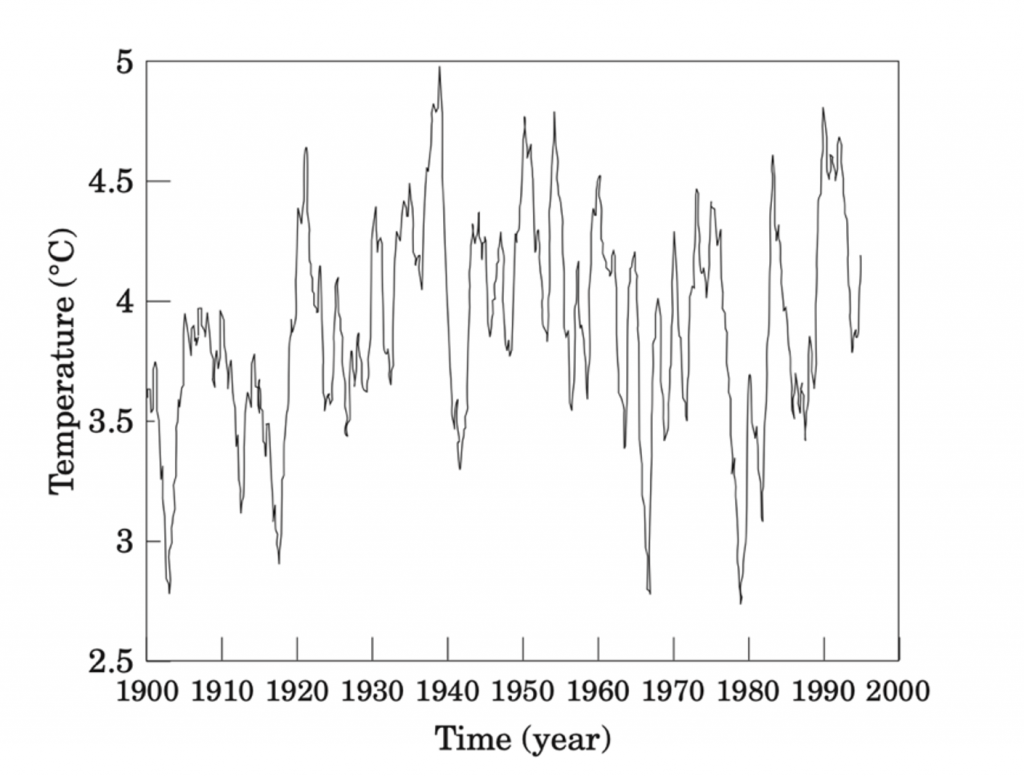
Figure 4. Updated Kola section temperature from 1900 to 1995, without annual variations.
Figure 4 shows the updated Kola section temperature after the inverse Fourier transformation. It reveals a cold climate period from about 1900-1920. From 1920-1945 there was a sea temperature warming period, before a new cooling period to approximately the year 1965. The cold period continued to 1980, before a new period of warming until 1995. At the same time, the Kola-section temperature data series has large temporary temperature fluctuations.
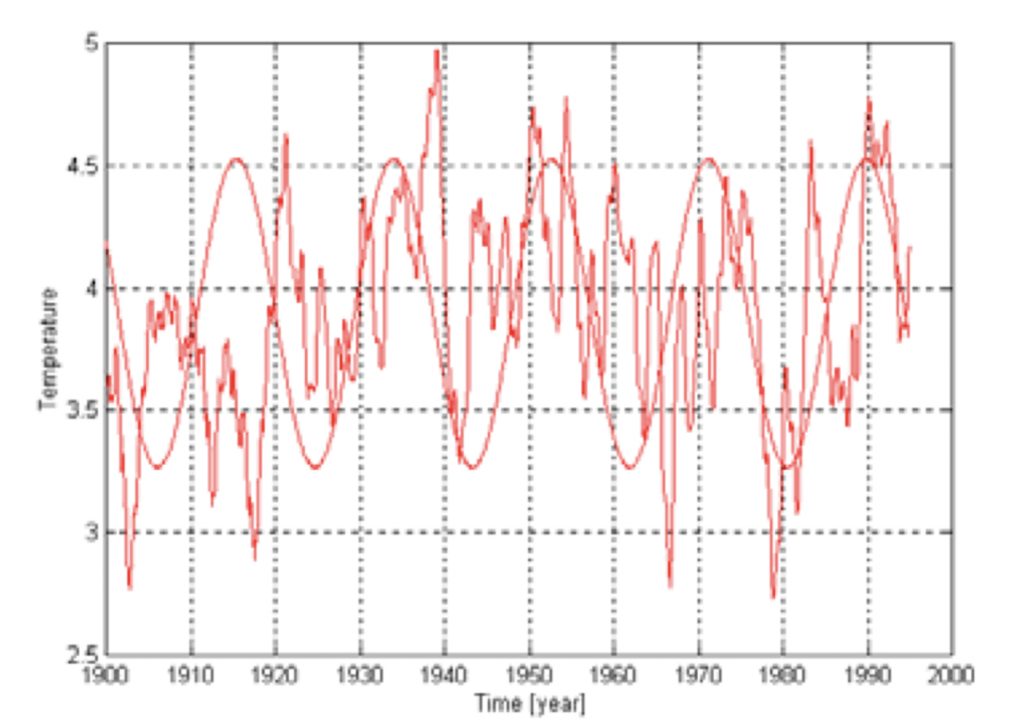
Figure 5. The Kola-section temperature from1900 to 1995, the 18.6-year Earth axis nutation cycle, and estimated 18-year cycle in the Kola section temperature data series.
The elliptical plane between the Earth and the Moon revolves with a period of 18.6 years. This causes the Earth’s axis to change direction by 9 seconds of arc in a period of 18.6 years. This period is known as the nutation of the Earth’s axis, which is contrilled by the Moon. When the Earth’s axis wobbles with a period of 18.6 years, it creates a standing tidal wave (lunar nodal tide) of 18.6 years between the pole and the equator. This long tidal wave has a vertical component and a horizontal component. The vertical component is only a few cm. This may explain why this wave has received little attention from oceanographers. The horizontal component affects the speed of global ocean currents and together they produce vertical mixing between cold and warm water in oceans. Surface water, heated by the sun sinks, and cold bottom water comes to the surface. The result is variations in the sea’s surface temperature and variations in the climate.
The nutation of 18.6 years has long been known to astrophysicists. Figure 5 shows that there is a direct coincidence between the Kola average temperature and the earth’s axis nutation period of 18.6 years. Here, for the first time, a direct connection between temperature variations in the Barents Sea and the earth’s axis nutation period of 18.61 years is revealed.
Earth nutation forced climate variations
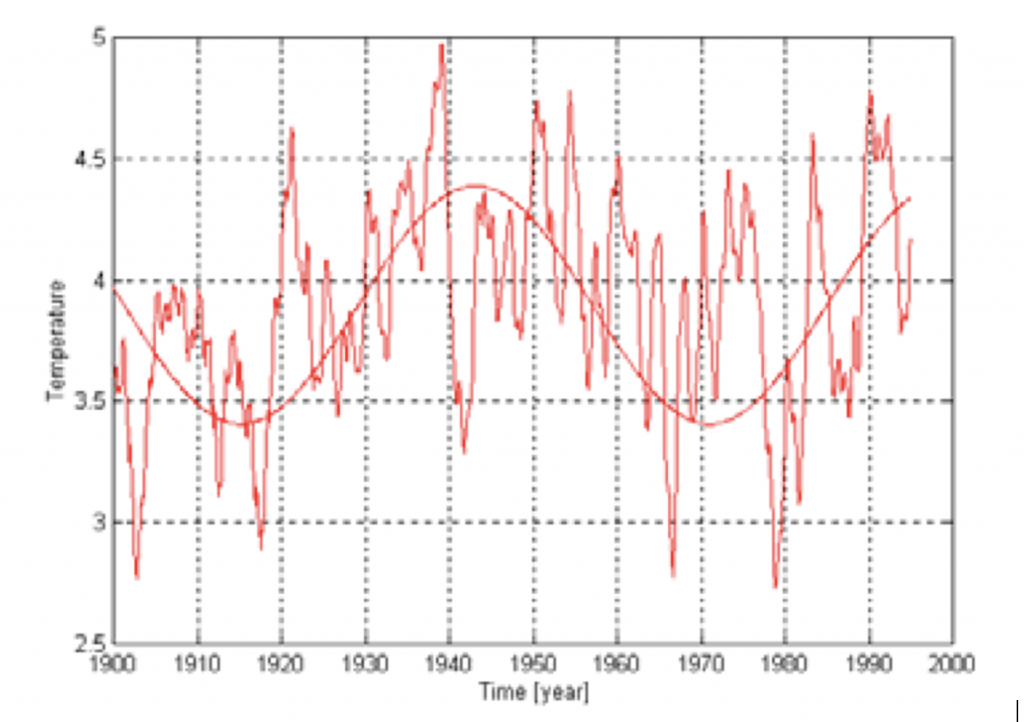
Figure 6. Measurements of the temperature at the Kola section every month from the year 1900 to 1995 and the period until the nutation of the earth’s axis of 3*18.6 = 55.8 years.
The 18.6-year Earth nutation cycle is a stationary period that has affected ocean currents and marine ecosystems for thousands of years. This has led to a lunar driven ocean current, climate periods, and variations in marine ecosystems. It is known from signal theory that stationary periods conserve energy by generating a harmonic spectrum. It turned out that the measurement series at the Kola section has a lunar driven temperature spectrum of [1/4, 1/3,1/2, 1, 3]18.6 years. Figure 6 shows that a lunar-driven period of 3*18.6 = 55.8 years forms the mean value of the ocean’s temperature variations from 1900 to 1995. It demonstrated, for the first time, that Arctic climate variations, are controlled by the earth’s rotation and the moon.
Lunar-driven cod recruitment
Recruitment of Norwegian Arctic cod increases exponentially with the temperature. This causes the biomass to recruit and to grow periodically. This may explain why the cod biomass growth is following the Kola-section temperature signature. More recruitment in the warm period explains why Norwegian Arctic cod is spawning after 6-7 years. Evolution has optimized a long-term growth by spawning twice in the warm part of the 18.6-year temperature cycle. Then it recruits less one time in the cold climate period.
ICES meeting in 1996
The analysis of the Kola section and North Atlantic cod was presented at: ICES Annual science Conference. Iceland 1996. After the presentation, a senior researcher came up to me and spoke. “Do you really believe this, that long tides has control of temperature and cod population growth?”. I replied: “I don’t believe anything. I only reveal information from your data series. But why do you think it is the wind that affects temperature variations in the Barents Sea?”.
The wind theory has its roots back to the German mathematician Karl Zöppritz (1838-1885). He developed a model that showed that wind can affect the ocean down to the great ocean depths. When random wind causes vertical mixing in oceans. When no one can predict the wind, no one can predict sea surface temperature. Lack of predictability reduces the basis for sustainable management. If it turns out that the temperature in the Barents Sea is driven by predictable tides, it may form a basis for better predictability of future sea temperatures, and better sustainable ecosystem management.
Iron curtain over natural climate science.
Soon it began to clear to me, I was moving into a conflict subject, that has been discussed for decades. The moon was associated with ancient superstitions. It had led to a stigmatization of scientists who studied the subject. At the same time, climate scientists lacked a unified theory that may explain causes of climate change. This enabled the UN’s climate panel to gain political acceptance for the idea of man-made global warming. The influence of the idea of man-made global warming, caused an iron curtain over natural climate science.
References
- Yndestad, H. 1996. Stationary temperature cycles in the Barents Sea The cause of causes ICES Annual Scince Conferene. Iceland 1996 Hydrography Committee C M 1996/C: 15
- Yndestad, H 1996. Systems dynamics of North arctic cod ICES Annual Science Conference. Iceland 1996 Hydrography Committee. C M 1996/C:14: Ref. G.
- Yndestad H. (1999). Earth nutation influence on the temperature regime of the Barents Sea. ICES Journal.
- Yndested H. (1999). Earth nutation influence on system dynamics of Northeast Arctic cod. ICES Journal.
“…surface water heated by the sun sinks…”
Surely you mean: surface water heated by the sun FLOATS on top and is conveyed by surface-currents to the poles (especially the northern) where it cools and also becomes saltier as sea-ice forms. NOW it is denser; HERE, it sinks (downwelling) – and flows in deep-currents back towards its origin. The circuit is completed by upwelling. About one-thousandth of the entire ocean is “turned over” in this way every year.
Nigel
Your comment is true. This is the salinity balance in Greenland Sea south of Svalbard.
I try to explain lunar nodal tide driven vertical mixing.
This is mixing is somewhere before Atlantic current reach the Norwegian Sea.
Harald
Harald
“…lunar nodal tide driven vertical mixing.”
So this is ADDITIONAL mixing? More complicated regionally than the rather simple textbook story of vertical mixing – down to approx 40 m – as an effect of winter storms.
Incidentally, I notice that Arctic Sea Ice has been more extensive this winter than it has been for some time. Also, Antarctic Sea Ice is “back to normal.”
Nigel
Nigel
The 18.6-year lunar nodal tide is a global standing wave controlled by the 18.5-year earth axis nutation.
This tide introduces a lunar node tide spectrum n*18.6 year.
My estimates reveals we are at a turning point and moving into a colder period and more ice extent.
Harald
You might be interested in astronomer Willy de Rop’s 1971 paper (2 pages), link here:
https://tallbloke.wordpress.com/2020/05/10/a-proof-of-de-rops-long-term-lunar-cycle-1799-anomalistic-years/
It says ‘period p corresponds to 5.996 667 350 anomalistic years’, which is when the sum of lunar nodal and apsidal cycles is 1, as shown in Figure 3.